Continuous Ranked Probability Score (CRPS)
Module Interface
- class torchmetrics.regression.crps.ContinuousRankedProbabilityScore(**kwargs)[source]
Computes continuous ranked probability score.
\[CRPS(F, y) = \int_{-\infty}^{\infty} (F(x) - 1_{x \geq y})^2 dx\]where \(F\) is the predicted cumulative distribution function and \(y\) is the true target. The metric is usually used to evaluate probabilistic regression models, such as forecasting models. A lower CRPS indicates a better forecast, meaning that forecasted probabilities are closer to the true observed values. CRPS can also be seen as a generalization of the brier score for non binary classification problems.
As input to
forwardandupdatethe metric accepts the following input:preds(Tensor): Predicted float tensor with shape(N,d)target(Tensor): Ground truth float tensor with shape(N,d)
As output of
forwardandcomputethe metric returns the following output:cosine_similarity(Tensor): A float tensor with the cosine similarity
- Parameters:
reduction¶ – how to reduce over the batch dimension using ‘sum’, ‘mean’ or ‘none’ (taking the individual scores)
kwargs¶ (
Any) – Additional keyword arguments, see Advanced metric settings for more info.
Example
>>> from torch import randn
>>> from torchmetrics.regression import ContinuousRankedProbabilityScore
>>> preds = randn(10, 5)
>>> target = randn(10)
>>> crps = ContinuousRankedProbabilityScore()
>>> crps(preds, target)
tensor(0.7731)
- plot(val=None, ax=None)[source]
Plot a single or multiple values from the metric.
- Parameters:
val¶ (
Union[Tensor,Sequence[Tensor],None]) – Either a single result from calling metric.forward or metric.compute or a list of these results. If no value is provided, will automatically call metric.compute and plot that result.ax¶ (
Optional[Axes]) – An matplotlib axis object. If provided will add plot to that axis
- Return type:
- Returns:
Figure and Axes object
- Raises:
ModuleNotFoundError – If matplotlib is not installed
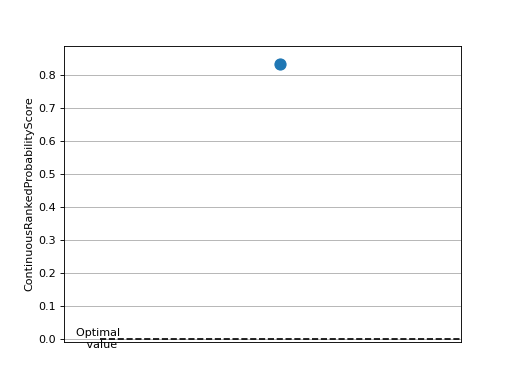
>>> from torch import randn
>>> # Example plotting a single value
>>> from torchmetrics.regression import ContinuousRankedProbabilityScore
>>> metric = ContinuousRankedProbabilityScore()
>>> metric.update(randn(10,5), randn(10))
>>> fig_, ax_ = metric.plot()
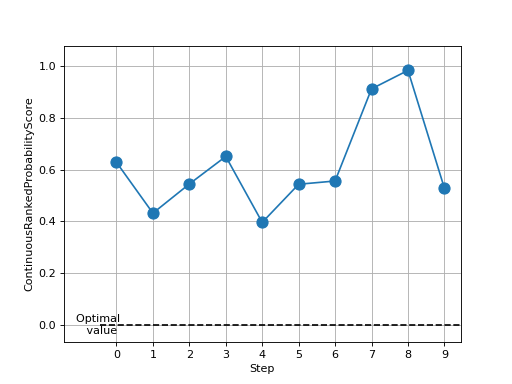
>>> from torch import randn
>>> # Example plotting multiple values
>>> from torchmetrics.regression import ContinuousRankedProbabilityScore
>>> metric = ContinuousRankedProbabilityScore()
>>> values = []
>>> for _ in range(10):
...     values.append(metric(randn(10,5), randn(10)))
>>> fig, ax = metric.plot(values)
Functional Interface
- torchmetrics.functional.regression.continuous_ranked_probability_score(preds, target)[source]
Computes continuous ranked probability score.
\[CRPS(F, y) = \int_{-\infty}^{\infty} (F(x) - 1_{x \geq y})^2 dx\]where \(F\) is the predicted cumulative distribution function and \(y\) is the true target. The metric is usually used to evaluate probabilistic regression models, such as forecasting models. A lower CRPS indicates a better forecast, meaning that forecasted probabilities are closer to the true observed values. CRPS can also be seen as a generalization of the brier score for non binary classification problems.
- Parameters:
- Return type:
- Returns:
Tensor with CRPS
- Raises:
ValueError – If the number of ensemble members is less than 2.
ValueError – If the first dimension of preds and target do not match.
- Example::
>>> from torchmetrics.functional.regression import continuous_ranked_probability_score
>>> from torch import randn
>>> preds = randn(10, 5)
>>> target = randn(10)
>>> continuous_ranked_probability_score(preds, target)
tensor(0.7731)
