Procrustes Disparity
Module Interface
- class torchmetrics.shape.ProcrustesDisparity(reduction='mean', **kwargs)[source]
Compute the Procrustes Disparity.
The Procrustes Disparity is defined as the sum of the squared differences between two datasets after applying a Procrustes transformation. The Procrustes Disparity is useful to compare two datasets that are similar but not aligned.
The metric works similar to
scipy.spatial.procrustesbut for batches of data points. The disparity is aggregated over the batch, thus to get the individual disparities please use the functional version of this metric:torchmetrics.functional.shape.procrustes.procrustes_disparity.As input to
forwardandupdatethe metric accepts the following input:point_cloud1(torch.Tensor): A tensor of shape(N, M, D)withNbeing the batch size,Mthe number of data points andDthe dimensionality of the data points.point_cloud2(torch.Tensor): A tensor of shape(N, M, D)withNbeing the batch size,Mthe number of data points andDthe dimensionality of the data points.
As output to
forwardandcomputethe metric returns the following output:gds(Tensor): A scalar tensor with the Procrustes Disparity.
- Parameters:
reduction¶ (
Literal['mean','sum']) – Determines whether to return the mean disparity or the sum of the disparities. Can be one of"mean"or"sum".kwargs¶ (
Any) – Additional keyword arguments, see Advanced metric settings for more info.
- Raises:
ValueError – If
averageis not one of"mean"or"sum".
Example
>>> from torch import randn
>>> from torchmetrics.shape import ProcrustesDisparity
>>> metric = ProcrustesDisparity()
>>> point_cloud1 = randn(10, 50, 2)
>>> point_cloud2 = randn(10, 50, 2)
>>> metric(point_cloud1, point_cloud2)
tensor(0.9770)
- plot(val=None, ax=None)[source]
Plot a single or multiple values from the metric.
- Parameters:
val¶ (
Union[Tensor,Sequence[Tensor],None]) – Either a single result from calling metric.forward or metric.compute or a list of these results. If no value is provided, will automatically call metric.compute and plot that result.ax¶ (
Optional[Axes]) – An matplotlib axis object. If provided will add plot to that axis
- Return type:
- Returns:
Figure and Axes object
- Raises:
ModuleNotFoundError – If matplotlib is not installed
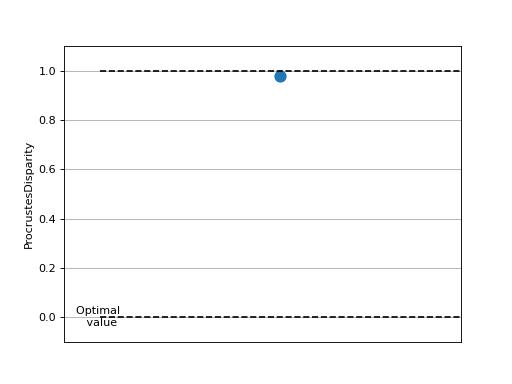
>>> # Example plotting a single value
>>> import torch
>>> from torchmetrics.shape import ProcrustesDisparity
>>> metric = ProcrustesDisparity()
>>> metric.update(torch.randn(10, 50, 2), torch.randn(10, 50, 2))
>>> fig_, ax_ = metric.plot()
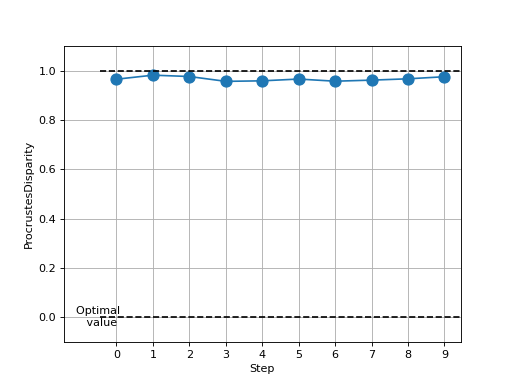
>>> # Example plotting multiple values
>>> import torch
>>> from torchmetrics.shape import ProcrustesDisparity
>>> metric = ProcrustesDisparity()
>>> values = [ ]
>>> for _ in range(10):
...     values.append(metric(torch.randn(10, 50, 2), torch.randn(10, 50, 2)))
>>> fig_, ax_ = metric.plot(values)