Tweedie Deviance Score
Module Interface
- class torchmetrics.TweedieDevianceScore(power=0.0, **kwargs)[source]
Compute the Tweedie Deviance Score.
\[\begin{split}deviance\_score(\hat{y},y) = \begin{cases} (\hat{y} - y)^2, & \text{for }p=0\\ 2 * (y * log(\frac{y}{\hat{y}}) + \hat{y} - y), & \text{for }p=1\\ 2 * (log(\frac{\hat{y}}{y}) + \frac{y}{\hat{y}} - 1), & \text{for }p=2\\ 2 * (\frac{(max(y,0))^{2 - p}}{(1 - p)(2 - p)} - \frac{y(\hat{y})^{1 - p}}{1 - p} + \frac{( \hat{y})^{2 - p}}{2 - p}), & \text{otherwise} \end{cases}\end{split}\]where \(y\) is a tensor of targets values, \(\hat{y}\) is a tensor of predictions, and \(p\) is the power.
As input to
forwardandupdatethe metric accepts the following input:preds(Tensor): Predicted float tensor with shape(N,...)target(Tensor): Ground truth float tensor with shape(N,...)
As output of
forwardandcomputethe metric returns the following output:deviance_score(Tensor): A tensor with the deviance score
- Parameters:
power < 0 : Extreme stable distribution. (Requires: preds > 0.)
power = 0 : Normal distribution. (Requires: targets and preds can be any real numbers.)
power = 1 : Poisson distribution. (Requires: targets >= 0 and y_pred > 0.)
1 < p < 2 : Compound Poisson distribution. (Requires: targets >= 0 and preds > 0.)
power = 2 : Gamma distribution. (Requires: targets > 0 and preds > 0.)
power = 3 : Inverse Gaussian distribution. (Requires: targets > 0 and preds > 0.)
otherwise : Positive stable distribution. (Requires: targets > 0 and preds > 0.)
kwargs¶ (
Any) – Additional keyword arguments, see Advanced metric settings for more info.
Example
>>> from torchmetrics.regression import TweedieDevianceScore
>>> targets = torch.tensor([1.0, 2.0, 3.0, 4.0])
>>> preds = torch.tensor([4.0, 3.0, 2.0, 1.0])
>>> deviance_score = TweedieDevianceScore(power=2)
>>> deviance_score(preds, targets)
tensor(1.2083)
- plot(val=None, ax=None)[source]
Plot a single or multiple values from the metric.
- Parameters:
val¶ (
Union[Tensor,Sequence[Tensor],None]) – Either a single result from calling metric.forward or metric.compute or a list of these results. If no value is provided, will automatically call metric.compute and plot that result.ax¶ (
Optional[Axes]) – An matplotlib axis object. If provided will add plot to that axis
- Return type:
- Returns:
Figure and Axes object
- Raises:
ModuleNotFoundError – If matplotlib is not installed
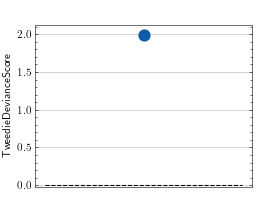
>>> from torch import randn
>>> # Example plotting a single value
>>> from torchmetrics.regression import TweedieDevianceScore
>>> metric = TweedieDevianceScore()
>>> metric.update(randn(10,), randn(10,))
>>> fig_, ax_ = metric.plot()
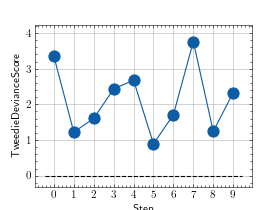
>>> from torch import randn
>>> # Example plotting multiple values
>>> from torchmetrics.regression import TweedieDevianceScore
>>> metric = TweedieDevianceScore()
>>> values = []
>>> for _ in range(10):
...     values.append(metric(randn(10,), randn(10,)))
>>> fig, ax = metric.plot(values)
Functional Interface
- torchmetrics.functional.tweedie_deviance_score(preds, targets, power=0.0)[source]
Compute the Tweedie Deviance Score.
\[\begin{split}deviance\_score(\hat{y},y) = \begin{cases} (\hat{y} - y)^2, & \text{for }p=0\\ 2 * (y * log(\frac{y}{\hat{y}}) + \hat{y} - y), & \text{for }p=1\\ 2 * (log(\frac{\hat{y}}{y}) + \frac{y}{\hat{y}} - 1), & \text{for }p=2\\ 2 * (\frac{(max(y,0))^{2 - p}}{(1 - p)(2 - p)} - \frac{y(\hat{y})^{1 - p}}{1 - p} + \frac{( \hat{y})^{2 - p}}{2 - p}), & \text{otherwise} \end{cases}\end{split}\]where \(y\) is a tensor of targets values, \(\hat{y}\) is a tensor of predictions, and \(p\) is the power.
- Parameters:
power < 0 : Extreme stable distribution. (Requires: preds > 0.)
power = 0 : Normal distribution. (Requires: targets and preds can be any real numbers.)
power = 1 : Poisson distribution. (Requires: targets >= 0 and y_pred > 0.)
1 < p < 2 : Compound Poisson distribution. (Requires: targets >= 0 and preds > 0.)
power = 2 : Gamma distribution. (Requires: targets > 0 and preds > 0.)
power = 3 : Inverse Gaussian distribution. (Requires: targets > 0 and preds > 0.)
otherwise : Positive stable distribution. (Requires: targets > 0 and preds > 0.)
- Return type:
Example
>>> from torchmetrics.functional.regression import tweedie_deviance_score
>>> targets = torch.tensor([1.0, 2.0, 3.0, 4.0])
>>> preds = torch.tensor([4.0, 3.0, 2.0, 1.0])
>>> tweedie_deviance_score(preds, targets, power=2)
tensor(1.2083)
