Note
Go to the end to download the full example code.
Evaluating Speech Quality with PESQ metric
- This notebook will guide you through calculating the Perceptual Evaluation of Speech Quality (PESQ) score,
a key metric in assessing how effective noise reduction and enhancement techniques are in improving speech quality. PESQ is widely adopted in industries such as telecommunications, VoIP, and audio processing. It provides an objective way to measure the perceived quality of speech signals from a human listener’s perspective.
- Imagine being on a noisy street, trying to have a phone call. The technology behind the scenes aims
to clean up your voice and make it sound clearer on the other end. But how do engineers measure that improvement? This is where PESQ comes in. In this notebook, we will simulate a similar scenario, applying a simple noise reduction technique and using the PESQ score to evaluate how much the speech quality improves.
Import necessary libraries
18 import matplotlib.pyplot as plt
19 import numpy as np
20 import torch
21 import torchaudio
22
23 from torchmetrics.audio import PerceptualEvaluationSpeechQuality
Generate Synthetic Clean and Noisy Audio Signals We’ll generate a clean sine wave (representing a clean speech signal) and add white noise to simulate the noisy version.
30 def generate_sine_wave(frequency, duration, sample_rate, amplitude: float = 0.5):
31     """Generate a clean sine wave at a given frequency."""
32     t = torch.linspace(0, duration, int(sample_rate * duration))
33     return amplitude * torch.sin(2 * np.pi * frequency * t)
34
35
36 def add_noise(waveform: torch.Tensor, noise_factor: float = 0.05) -> torch.Tensor:
37     """Add white noise to a waveform."""
38     noise = noise_factor * torch.randn(waveform.size())
39     return waveform + noise
40
41
42 # Parameters for the synthetic audio
43 sample_rate = 16000  # 16 kHz typical for speech
44 duration = 3  # 3 seconds of audio
45 frequency = 440  # A4 note, can represent a simple speech-like tone
46
47 # Generate the clean sine wave
48 clean_waveform = generate_sine_wave(frequency, duration, sample_rate)
49
50 # Generate the noisy waveform by adding white noise
51 noisy_waveform = add_noise(clean_waveform)
Apply Basic Noise Reduction Technique In this step, we apply a simple spectral gating method for noise reduction using torchaudio’s spectrogram method. This is to simulate the enhancement of noisy speech.
60 def reduce_noise(noisy_signal: torch.Tensor, threshold: float = 0.2) -> torch.Tensor:
61     """Basic noise reduction using spectral gating."""
62     # Compute the spectrogram
63     spec = torchaudio.transforms.Spectrogram()(noisy_signal)
64
65     # Apply threshold-based gating: values below the threshold will be zeroed out
66     spec_denoised = spec * (spec > threshold)
67
68     # Convert back to the waveform
69     return torchaudio.transforms.GriffinLim()(spec_denoised)
70
71
72 # Apply noise reduction to the noisy waveform
73 enhanced_waveform = reduce_noise(noisy_waveform)
Initialize the PESQ Metric PESQ can be computed in two modes: ‘wb’ (wideband) or ‘nb’ (narrowband). Here, we are using ‘wb’ mode for wideband speech quality evaluation.
79 pesq_metric = PerceptualEvaluationSpeechQuality(fs=sample_rate, mode="wb")
Compute PESQ Scores We will calculate the PESQ scores for both the noisy and enhanced versions compared to the clean signal. The PESQ scores give us a numerical evaluation of how well the enhanced speech compares to the clean speech. Higher scores indicate better quality.
87 pesq_noisy = pesq_metric(clean_waveform, noisy_waveform)
88 pesq_enhanced = pesq_metric(clean_waveform, enhanced_waveform)
89
90 print(f"PESQ Score for Noisy Audio: {pesq_noisy.item():.4f}")
91 print(f"PESQ Score for Enhanced Audio: {pesq_enhanced.item():.4f}")
PESQ Score for Noisy Audio: 3.0757
PESQ Score for Enhanced Audio: 3.7905
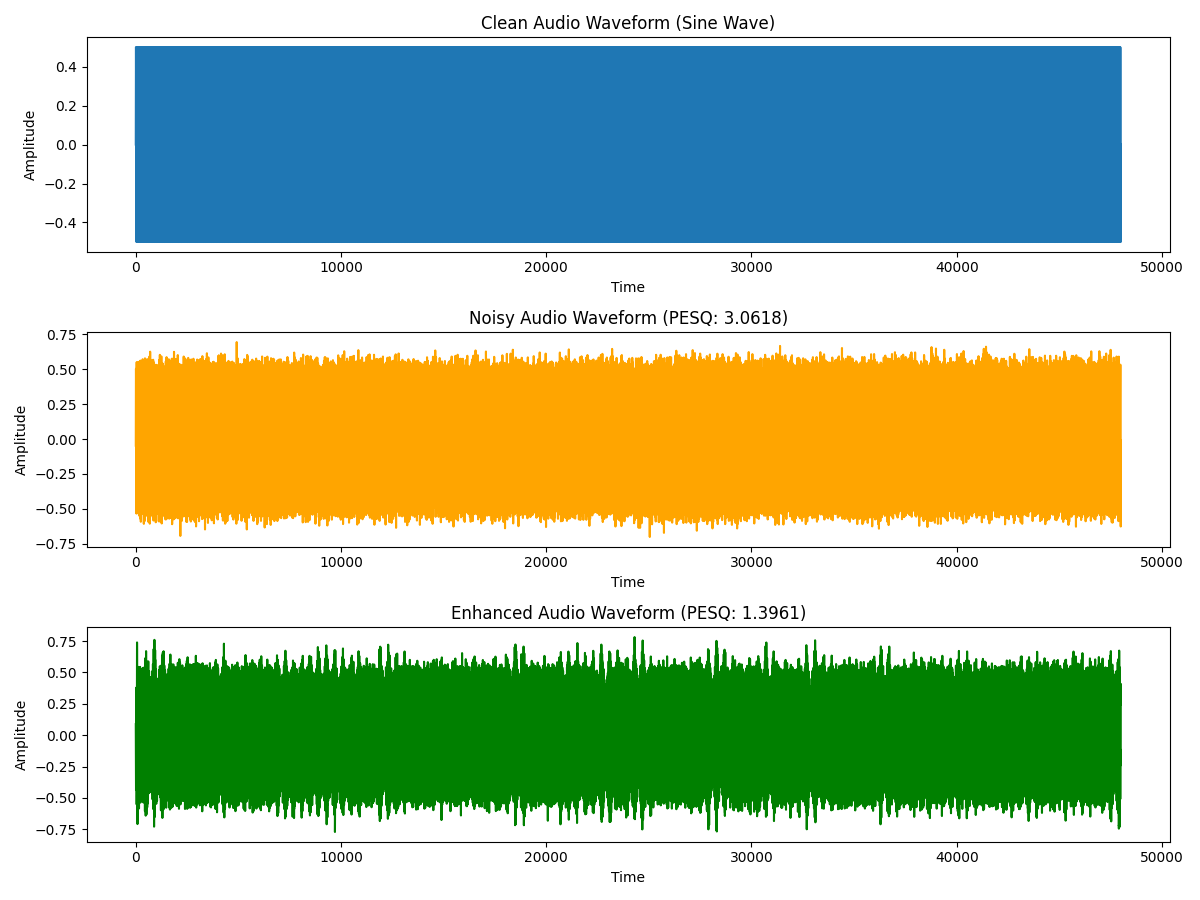
Visualize the waveforms We can visualize the waveforms of the clean, noisy, and enhanced audio to see the differences.
 96 fig, axs = plt.subplots(3, 1, figsize=(12, 9))
 97
 98 # Plot clean waveform
 99 axs[0].plot(clean_waveform.numpy())
100 axs[0].set_title("Clean Audio Waveform (Sine Wave)")
101 axs[0].set_xlabel("Time")
102 axs[0].set_ylabel("Amplitude")
103
104 # Plot noisy waveform
105 axs[1].plot(noisy_waveform.numpy(), color="orange")
106 axs[1].set_title(f"Noisy Audio Waveform (PESQ: {pesq_noisy.item():.4f})")
107 axs[1].set_xlabel("Time")
108 axs[1].set_ylabel("Amplitude")
109
110 # Plot enhanced waveform
111 axs[2].plot(enhanced_waveform.numpy(), color="green")
112 axs[2].set_title(f"Enhanced Audio Waveform (PESQ: {pesq_enhanced.item():.4f})")
113 axs[2].set_xlabel("Time")
114 axs[2].set_ylabel("Amplitude")
115
116 # Adjust layout for better visualization
117 fig.tight_layout()
118 plt.show()
Total running time of the script: (0 minutes 0.858 seconds)
