
Tschuprow's T
Module Interface
- class torchmetrics.nominal.TschuprowsT(num_classes, bias_correction=True, nan_strategy='replace', nan_replace_value=0.0, **kwargs)[source]
Compute Tschuprow’s T statistic measuring the association between two categorical (nominal) data series.
where
where denotes the number of times the values are observed with represent frequencies of values in
predsandtarget, respectively. Tschuprow’s T is a symmetric coefficient, i.e. , so order of input arguments does not matter. The output values lies in [0, 1] with 1 meaning the perfect association.As input to
forwardandupdatethe metric accepts the following input:preds(Tensor): Either 1D or 2D tensor of categorical (nominal) data from the first data series with shape(batch_size,)or(batch_size, num_classes), respectively.target(Tensor): Either 1D or 2D tensor of categorical (nominal) data from the second data series with shape(batch_size,)or(batch_size, num_classes), respectively.
As output of
forwardandcomputethe metric returns the following output:tschuprows_t(Tensor): Scalar tensor containing the Tschuprow’s T statistic.
- Parameters:
num_classes (
int) – Integer specifying the number of classesbias_correction (
bool) – Indication of whether to use bias correction.nan_strategy (
Literal['replace','drop']) – Indication of whether to replace or dropNaNvaluesnan_replace_value (
Optional[float]) – Value to replaceNaN``s when ``nan_strategy = 'replace'kwargs (
Any) – Additional keyword arguments, see Advanced metric settings for more info.
- Raises:
ValueError – If nan_strategy is not one of ‘replace’ and ‘drop’
ValueError – If nan_strategy is equal to ‘replace’ and nan_replace_value is not an int or float
Example:
>>> from torch import randint >>> from torchmetrics.nominal import TschuprowsT >>> preds = randint(0, 4, (100,)) >>> target = (preds + torch.randn(100)).round().clamp(0, 4) >>> tschuprows_t = TschuprowsT(num_classes=5) >>> tschuprows_t(preds, target) tensor(0.4930)- plot(val=None, ax=None)[source]
Plot a single or multiple values from the metric.
- Parameters:
val (
Union[Tensor,Sequence[Tensor],None]) – Either a single result from calling metric.forward or metric.compute or a list of these results. If no value is provided, will automatically call metric.compute and plot that result.ax (
Optional[Axes]) – An matplotlib axis object. If provided will add plot to that axis
- Return type:
- Returns:
Figure and Axes object
- Raises:
ModuleNotFoundError – If matplotlib is not installed
>>> # Example plotting a single value
>>> import torch
>>> from torchmetrics.nominal import TschuprowsT
>>> metric = TschuprowsT(num_classes=5)
>>> metric.update(torch.randint(0, 4, (100,)), torch.randint(0, 4, (100,)))
>>> fig_, ax_ = metric.plot()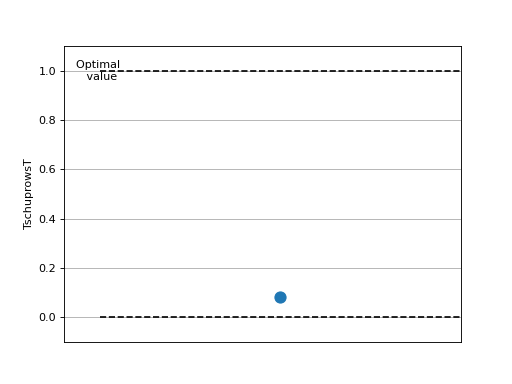
>>> # Example plotting multiple values
>>> import torch
>>> from torchmetrics.nominal import TschuprowsT
>>> metric = TschuprowsT(num_classes=5)
>>> values = [ ]
>>> for _ in range(10):
...     values.append(metric(torch.randint(0, 4, (100,)), torch.randint(0, 4, (100,))))
>>> fig_, ax_ = metric.plot(values)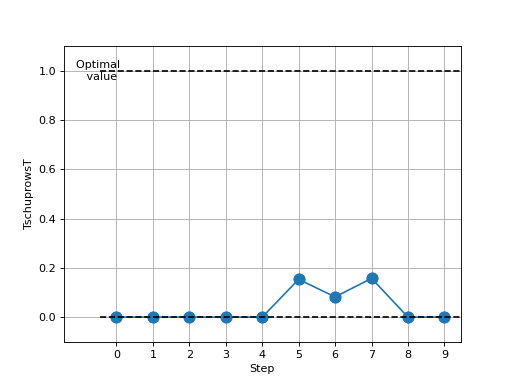
Functional Interface
- torchmetrics.functional.nominal.tschuprows_t(preds, target, bias_correction=True, nan_strategy='replace', nan_replace_value=0.0)[source]
Compute Tschuprow’s T statistic measuring the association between two categorical (nominal) data series.
where
where denotes the number of times the values are observed with represent frequencies of values in
predsandtarget, respectively.Tschuprow’s T is a symmetric coefficient, i.e. .
The output values lies in [0, 1] with 1 meaning the perfect association.
- Parameters:
preds (
Tensor) –1D or 2D tensor of categorical (nominal) data:
1D shape: (batch_size,)
2D shape: (batch_size, num_classes)
target (
Tensor) –1D or 2D tensor of categorical (nominal) data:
1D shape: (batch_size,)
2D shape: (batch_size, num_classes)
bias_correction (
bool) – Indication of whether to use bias correction.nan_strategy (
Literal['replace','drop']) – Indication of whether to replace or dropNaNvaluesnan_replace_value (
Optional[float]) – Value to replaceNaN``s when ``nan_strategy = 'replace'
- Return type:
- Returns:
Tschuprow’s T statistic
Example
>>> from torch import randint, round
>>> from torchmetrics.functional.nominal import tschuprows_t
>>> preds = randint(0, 4, (100,))
>>> target = round(preds + torch.randn(100)).clamp(0, 4)
>>> tschuprows_t(preds, target)
tensor(0.4930)
tschuprows_t_matrix
- torchmetrics.functional.nominal.tschuprows_t_matrix(matrix, bias_correction=True, nan_strategy='replace', nan_replace_value=0.0)[source]
Compute Tschuprow’s T statistic between a set of multiple variables.
This can serve as a convenient tool to compute Tschuprow’s T statistic for analyses of correlation between categorical variables in your dataset.
- Parameters:
matrix (
Tensor) –A tensor of categorical (nominal) data, where:
rows represent a number of data points
columns represent a number of categorical (nominal) features
bias_correction (
bool) – Indication of whether to use bias correction.nan_strategy (
Literal['replace','drop']) – Indication of whether to replace or dropNaNvaluesnan_replace_value (
Optional[float]) – Value to replaceNaN``s when ``nan_strategy = 'replace'
- Return type:
- Returns:
Tschuprow’s T statistic for a dataset of categorical variables
Example
>>> from torch import randint
>>> from torchmetrics.functional.nominal import tschuprows_t_matrix
>>> matrix = randint(0, 4, (200, 5))
>>> tschuprows_t_matrix(matrix)
tensor([[1.0000, 0.0637, 0.0000, 0.0542, 0.1337],
        [0.0637, 1.0000, 0.0000, 0.0000, 0.0000],
        [0.0000, 0.0000, 1.0000, 0.0000, 0.0649],
        [0.0542, 0.0000, 0.0000, 1.0000, 0.1100],
        [0.1337, 0.0000, 0.0649, 0.1100, 1.0000]])
Was this page helpful?
Thanks for the feedback.