Tschuprow’s T
Module Interface
- class torchmetrics.nominal.TschuprowsT(num_classes, bias_correction=True, nan_strategy='replace', nan_replace_value=0.0, **kwargs)[source]
Compute Tschuprow’s T statistic measuring the association between two categorical (nominal) data series.

where

where
 denotes the number of times the values
  are observed
with
are observed
with  represent frequencies of values in
 predsandtarget, respectively.Tschuprow’s T is a symmetric coefficient, i.e.
 .
.The output values lies in [0, 1] with 1 meaning the perfect association.
- Parameters:
num_classes¶ (
int) – Integer specifing the number of classesbias_correction¶ (
bool) – Indication of whether to use bias correction.nan_strategy¶ (
Literal['replace','drop']) – Indication of whether to replace or dropNaNvaluesnan_replace_value¶ (
Union[int,float,None]) – Value to replaceNaN``s when ``nan_strategy = 'replace'kwargs¶ (
Any) – Additional keyword arguments, see Advanced metric settings for more info.
- Returns:
Tschuprow’s T statistic
- Raises:
ValueError – If nan_strategy is not one of ‘replace’ and ‘drop’
ValueError – If nan_strategy is equal to ‘replace’ and nan_replace_value is not an int or float
Example
>>> from torchmetrics.nominal import TschuprowsT
>>> _ = torch.manual_seed(42)
>>> preds = torch.randint(0, 4, (100,))
>>> target = torch.round(preds + torch.randn(100)).clamp(0, 4)
>>> tschuprows_t = TschuprowsT(num_classes=5)
>>> tschuprows_t(preds, target)
tensor(0.4930)
- plot(val=None, ax=None)[source]
Plot a single or multiple values from the metric.
- Parameters:
val¶ (
Union[Tensor,Sequence[Tensor],None]) – Either a single result from calling metric.forward or metric.compute or a list of these results. If no value is provided, will automatically call metric.compute and plot that result.ax¶ (
Optional[Axes]) – An matplotlib axis object. If provided will add plot to that axis
- Return type:
- Returns:
Figure and Axes object
- Raises:
ModuleNotFoundError – If matplotlib is not installed
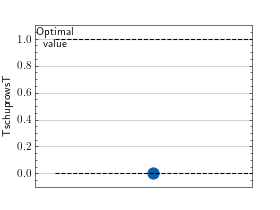
>>> # Example plotting a single value
>>> import torch
>>> from torchmetrics.nominal import TschuprowsT
>>> metric = TschuprowsT(num_classes=5)
>>> metric.update(torch.randint(0, 4, (100,)), torch.randint(0, 4, (100,)))
>>> fig_, ax_ = metric.plot()
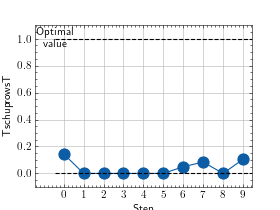
>>> # Example plotting multiple values
>>> import torch
>>> from torchmetrics.nominal import TschuprowsT
>>> metric = TschuprowsT(num_classes=5)
>>> values = [ ]
>>> for _ in range(10):
...     values.append(metric(torch.randint(0, 4, (100,)), torch.randint(0, 4, (100,))))
>>> fig_, ax_ = metric.plot(values)
Functional Interface
- torchmetrics.functional.nominal.tschuprows_t(preds, target, bias_correction=True, nan_strategy='replace', nan_replace_value=0.0)[source]
Compute Tschuprow’s T statistic measuring the association between two categorical (nominal) data series.
where
where
denotes the number of times the values are observed with
represent frequencies of values in predsandtarget, respectively.Tschuprow’s T is a symmetric coefficient, i.e.
.The output values lies in [0, 1] with 1 meaning the perfect association.
- Parameters:
1D or 2D tensor of categorical (nominal) data:
1D shape: (batch_size,)
2D shape: (batch_size, num_classes)
1D or 2D tensor of categorical (nominal) data:
1D shape: (batch_size,)
2D shape: (batch_size, num_classes)
bias_correction¶ (
bool) – Indication of whether to use bias correction.nan_strategy¶ (
Literal['replace','drop']) – Indication of whether to replace or dropNaNvaluesnan_replace_value¶ (
Union[int,float,None]) – Value to replaceNaN``s when ``nan_strategy = 'replace'
- Return type:
- Returns:
Tschuprow’s T statistic
Example
>>> from torchmetrics.functional.nominal import tschuprows_t
>>> _ = torch.manual_seed(42)
>>> preds = torch.randint(0, 4, (100,))
>>> target = torch.round(preds + torch.randn(100)).clamp(0, 4)
>>> tschuprows_t(preds, target)
tensor(0.4930)
tschuprows_t_matrix
- torchmetrics.functional.nominal.tschuprows_t_matrix(matrix, bias_correction=True, nan_strategy='replace', nan_replace_value=0.0)[source]
Compute Tschuprow’s T statistic between a set of multiple variables.
This can serve as a convenient tool to compute Tschuprow’s T statistic for analyses of correlation between categorical variables in your dataset.
- Parameters:
A tensor of categorical (nominal) data, where:
rows represent a number of data points
columns represent a number of categorical (nominal) features
bias_correction¶ (
bool) – Indication of whether to use bias correction.nan_strategy¶ (
Literal['replace','drop']) – Indication of whether to replace or dropNaNvaluesnan_replace_value¶ (
Union[int,float,None]) – Value to replaceNaN``s when ``nan_strategy = 'replace'
- Return type:
- Returns:
Tschuprow’s T statistic for a dataset of categorical variables
Example
>>> from torchmetrics.functional.nominal import tschuprows_t_matrix
>>> _ = torch.manual_seed(42)
>>> matrix = torch.randint(0, 4, (200, 5))
>>> tschuprows_t_matrix(matrix)
tensor([[1.0000, 0.0637, 0.0000, 0.0542, 0.1337],
        [0.0637, 1.0000, 0.0000, 0.0000, 0.0000],
        [0.0000, 0.0000, 1.0000, 0.0000, 0.0649],
        [0.0542, 0.0000, 0.0000, 1.0000, 0.1100],
        [0.1337, 0.0000, 0.0649, 0.1100, 1.0000]])
