In this Lightning Bits episode, William and Sebastian show you how to debug Python code with PyCharm and pdb. They discuss breakpoints, variable swapping with the console, and many tips and tricks. Watch the video, or continue reading below.
Debugging Python Code
Learning and using a professional debugging tool is one of the key things you can do to boost your productivity. Sure, you can often get by with the good old “print()” statement approach. However, instead of inserting print statements all over your code, it is often more productive to set a breakpoint, jump into the code, and execute it line by line while inspecting the variables.
Debugging in PyCharm
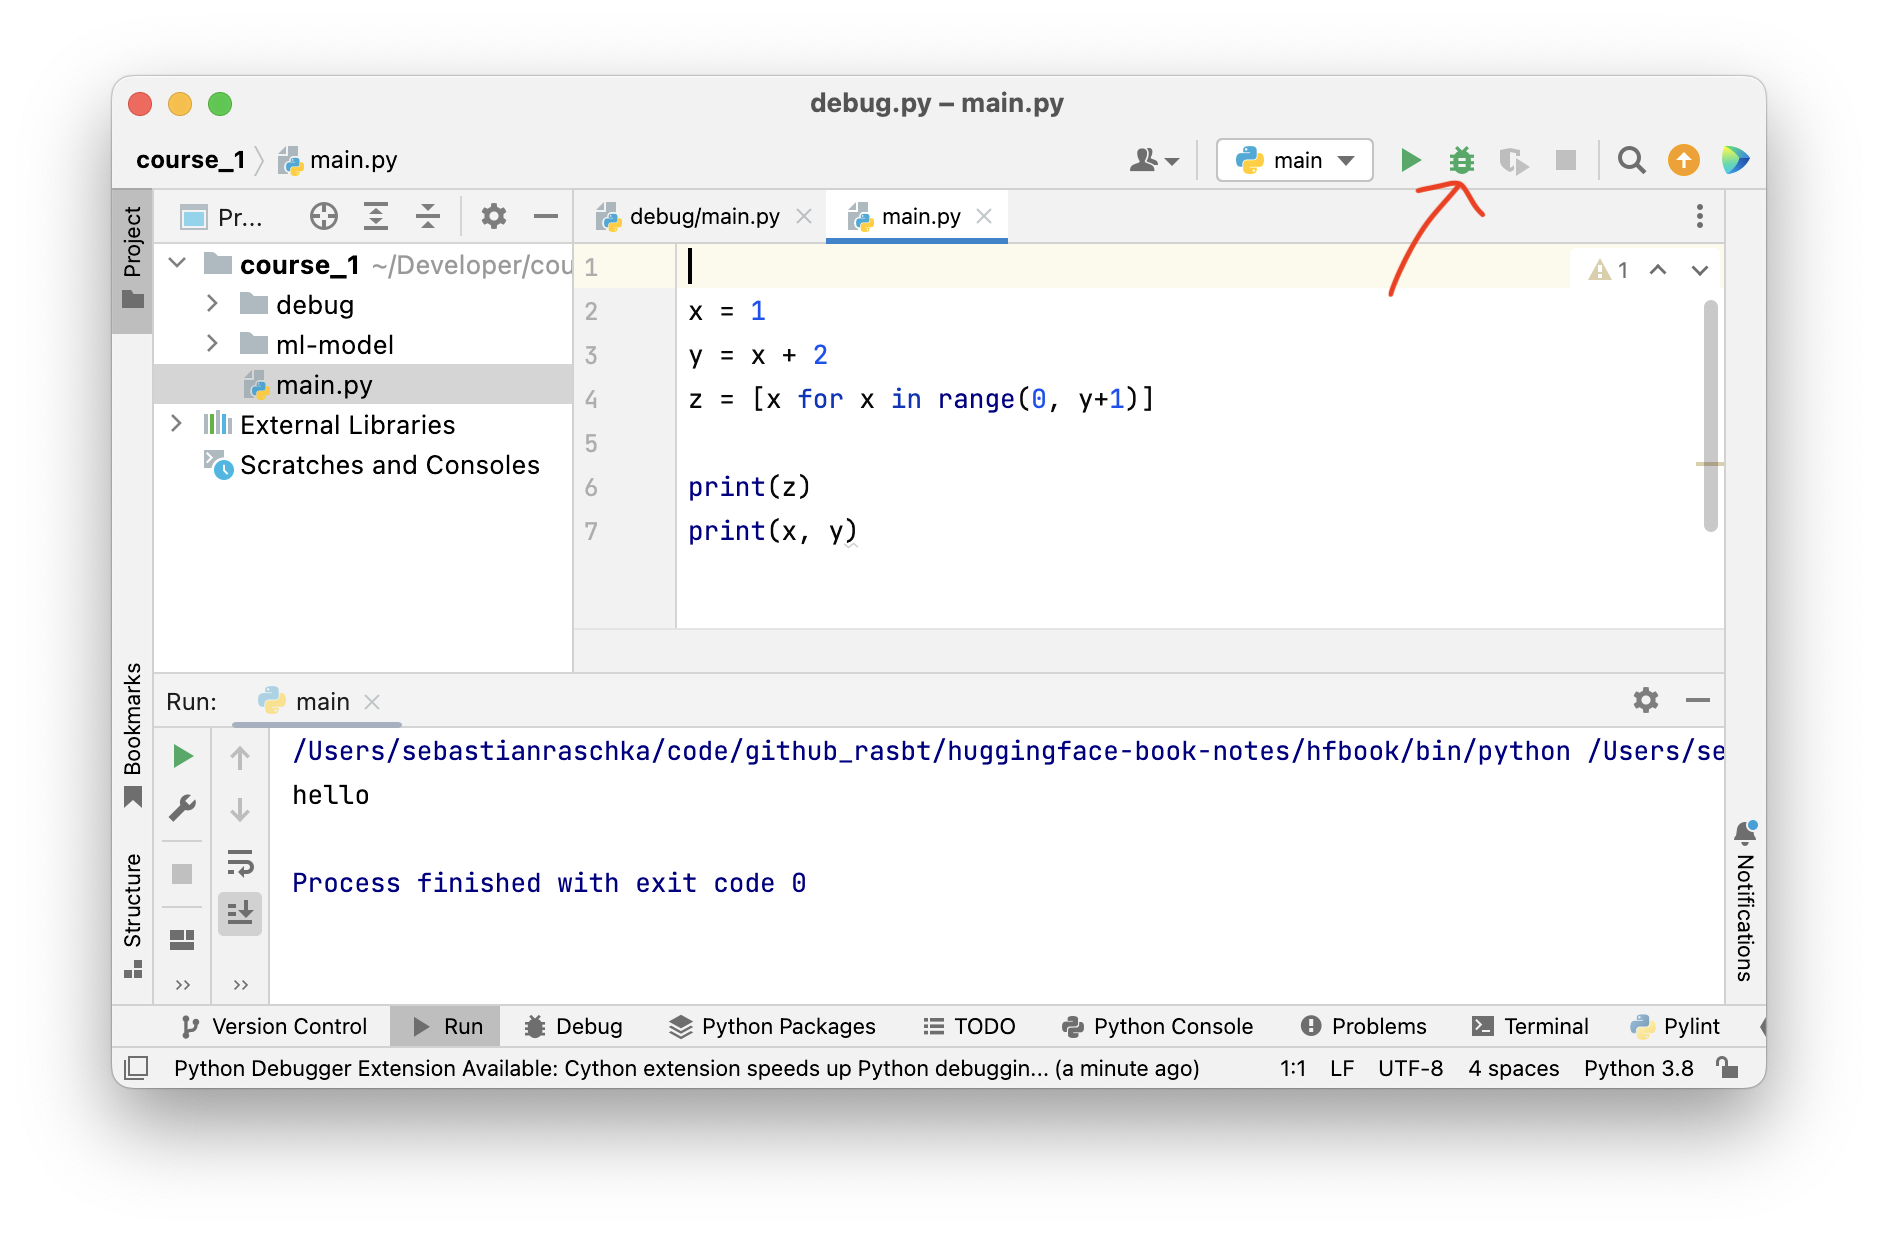
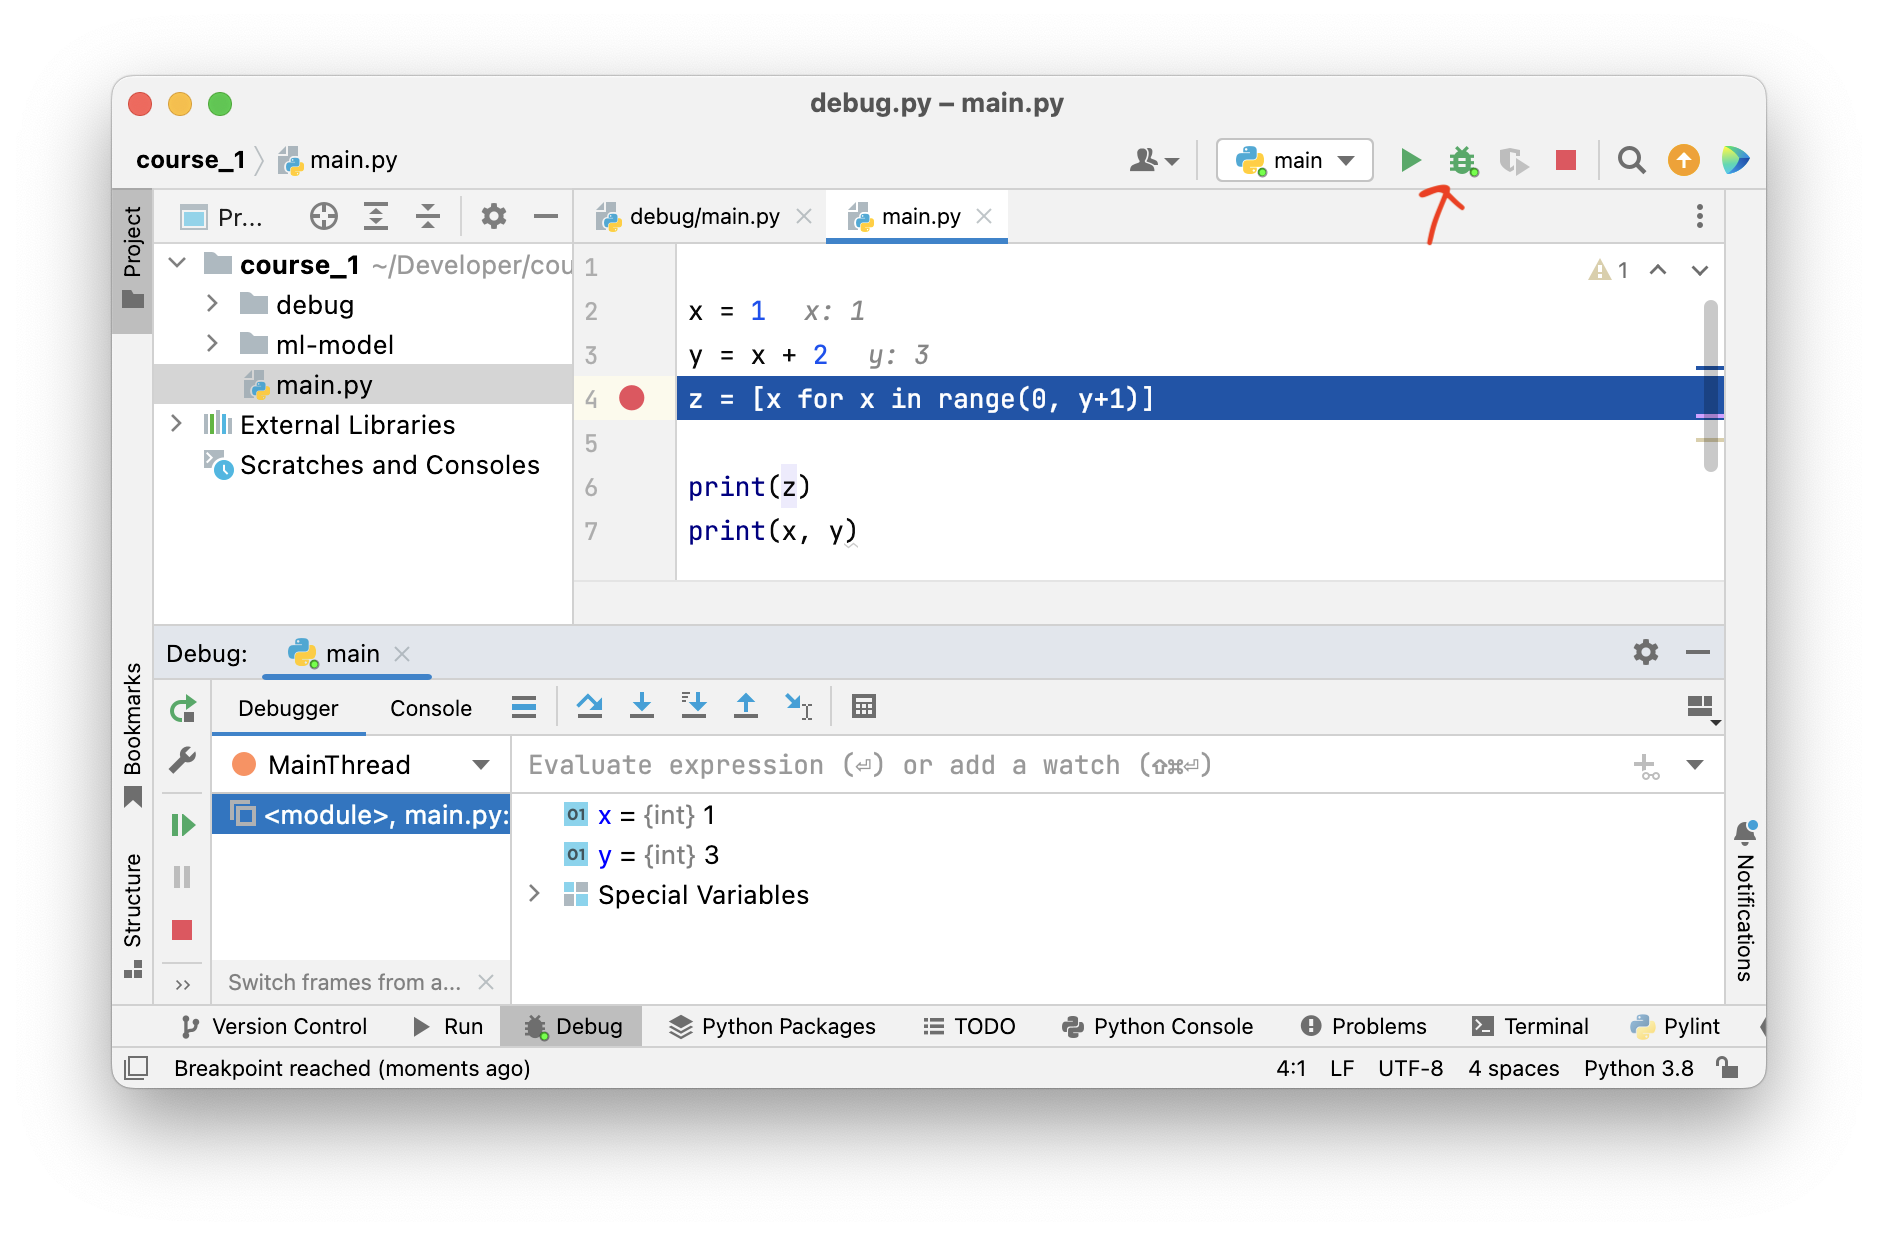
In PyCharm, you can launch the debugger by clicking on the “bug” symbol in the upper right corner:
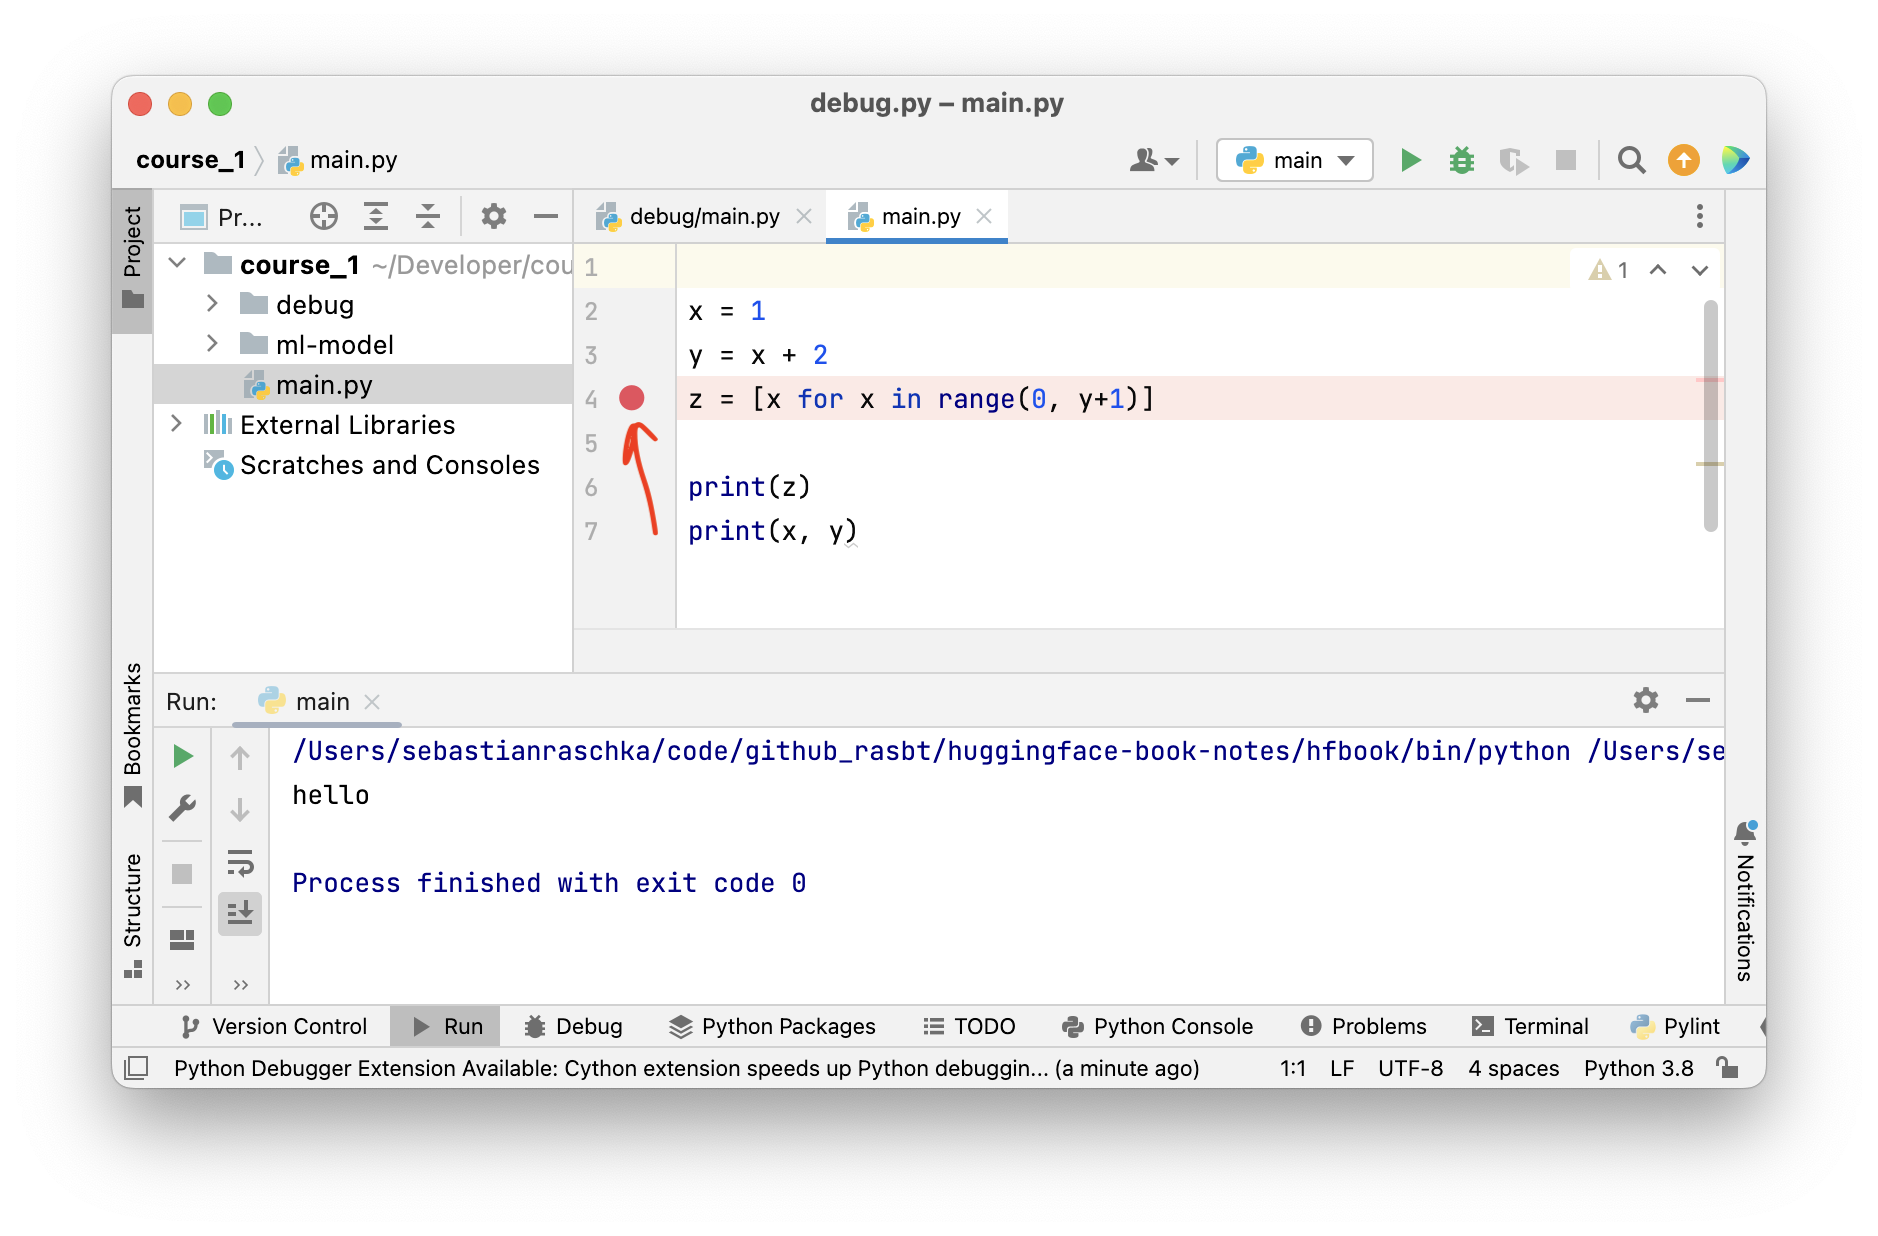
Then, you can set a breakpoint by clicking next to the line number: a red dot should appear:
Now, if you run the debugger again, the code should stop at the breakpoint, and you should see the variable contents and so forth:
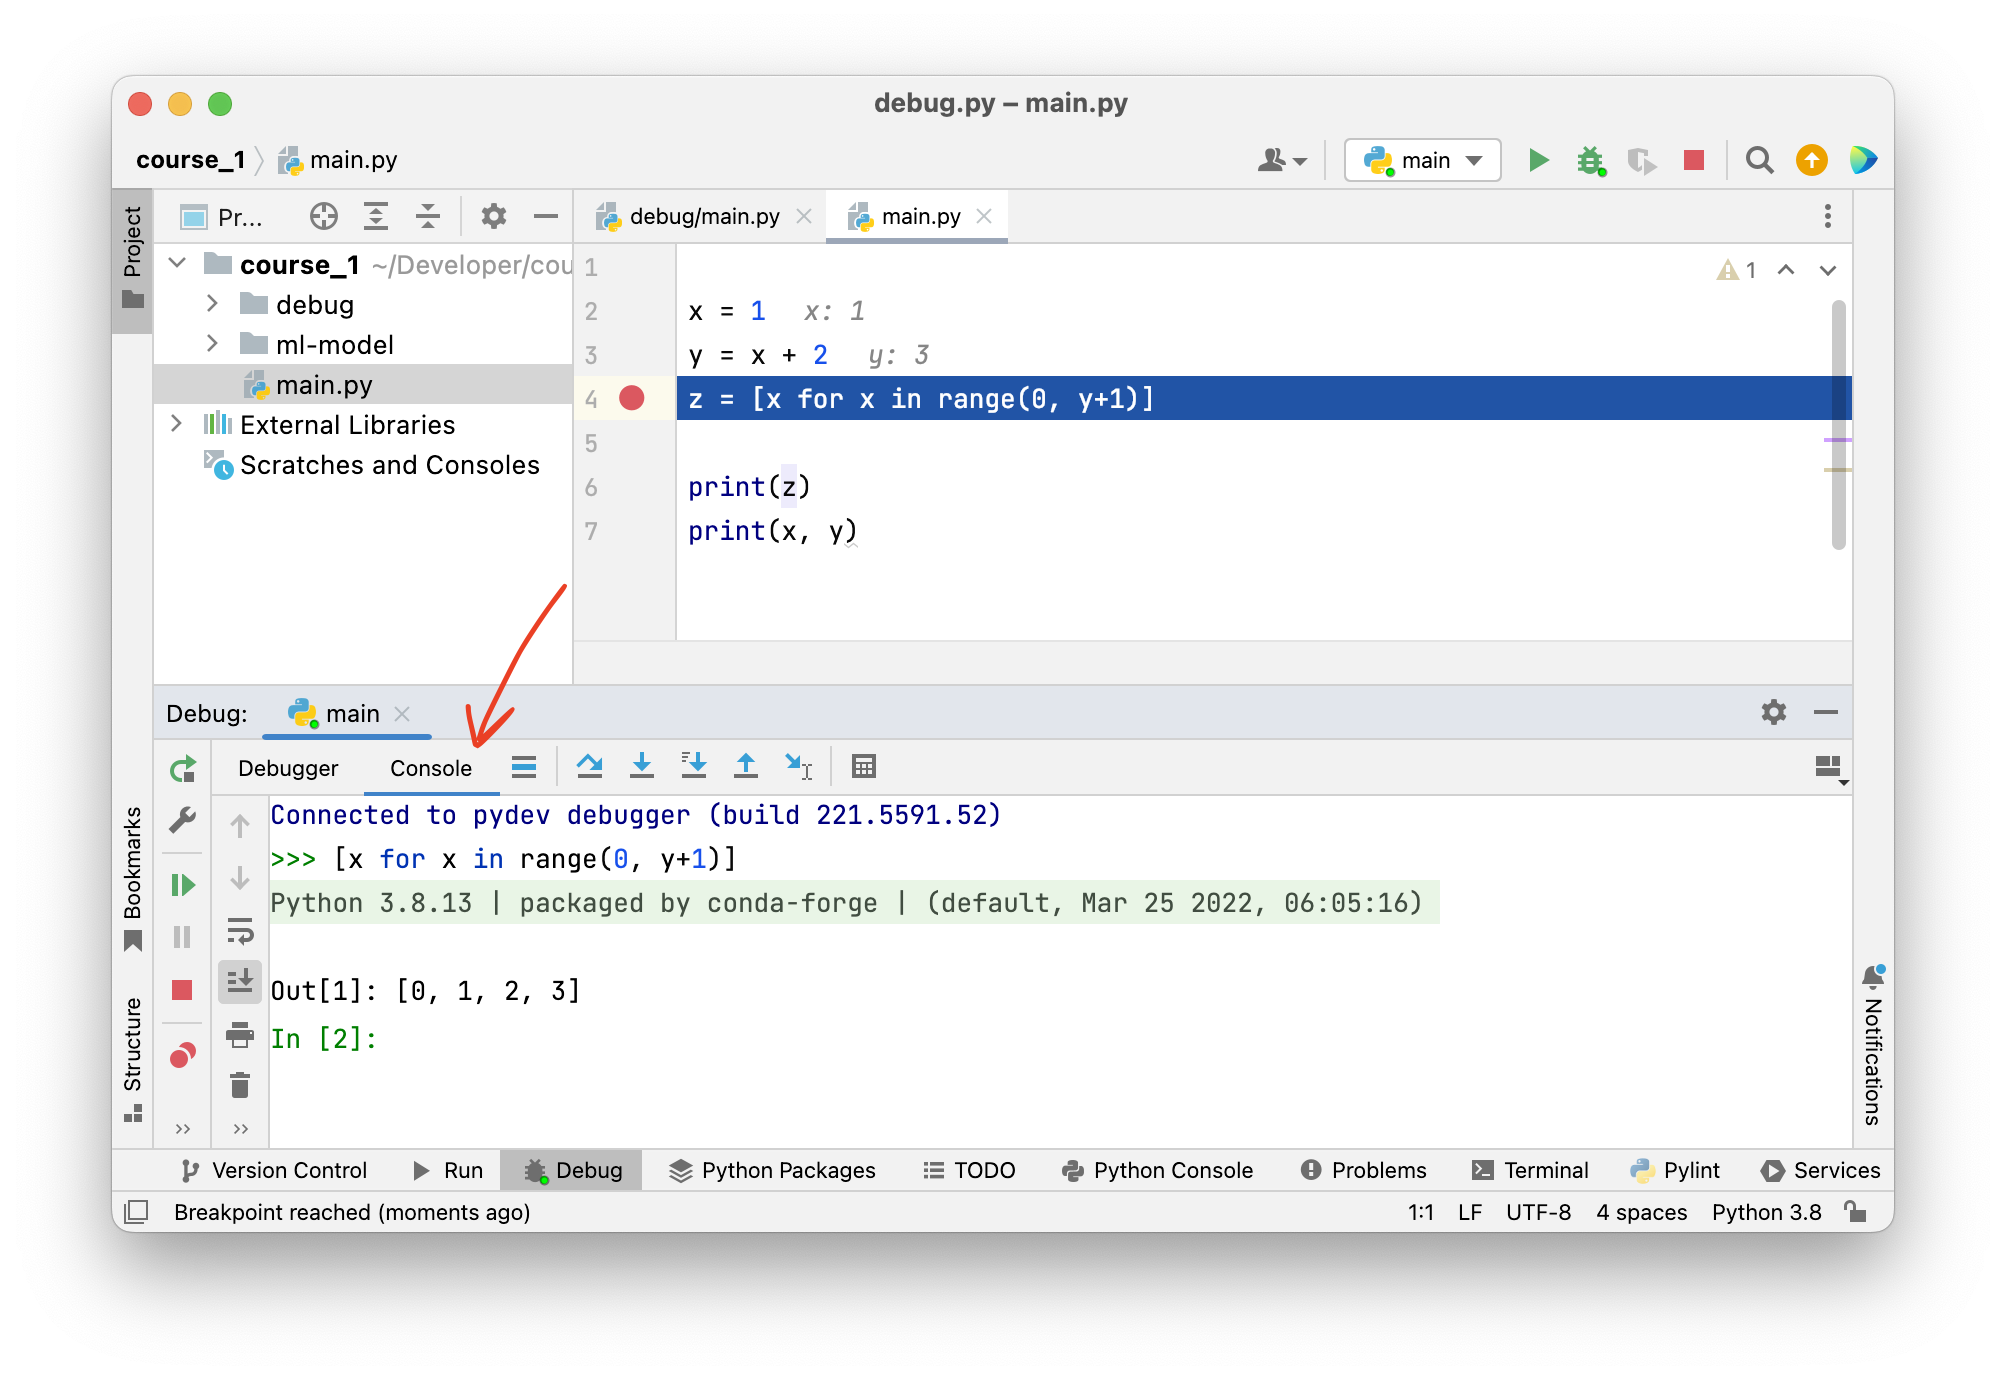
Then, we can go the to the console and explore the code interactively:
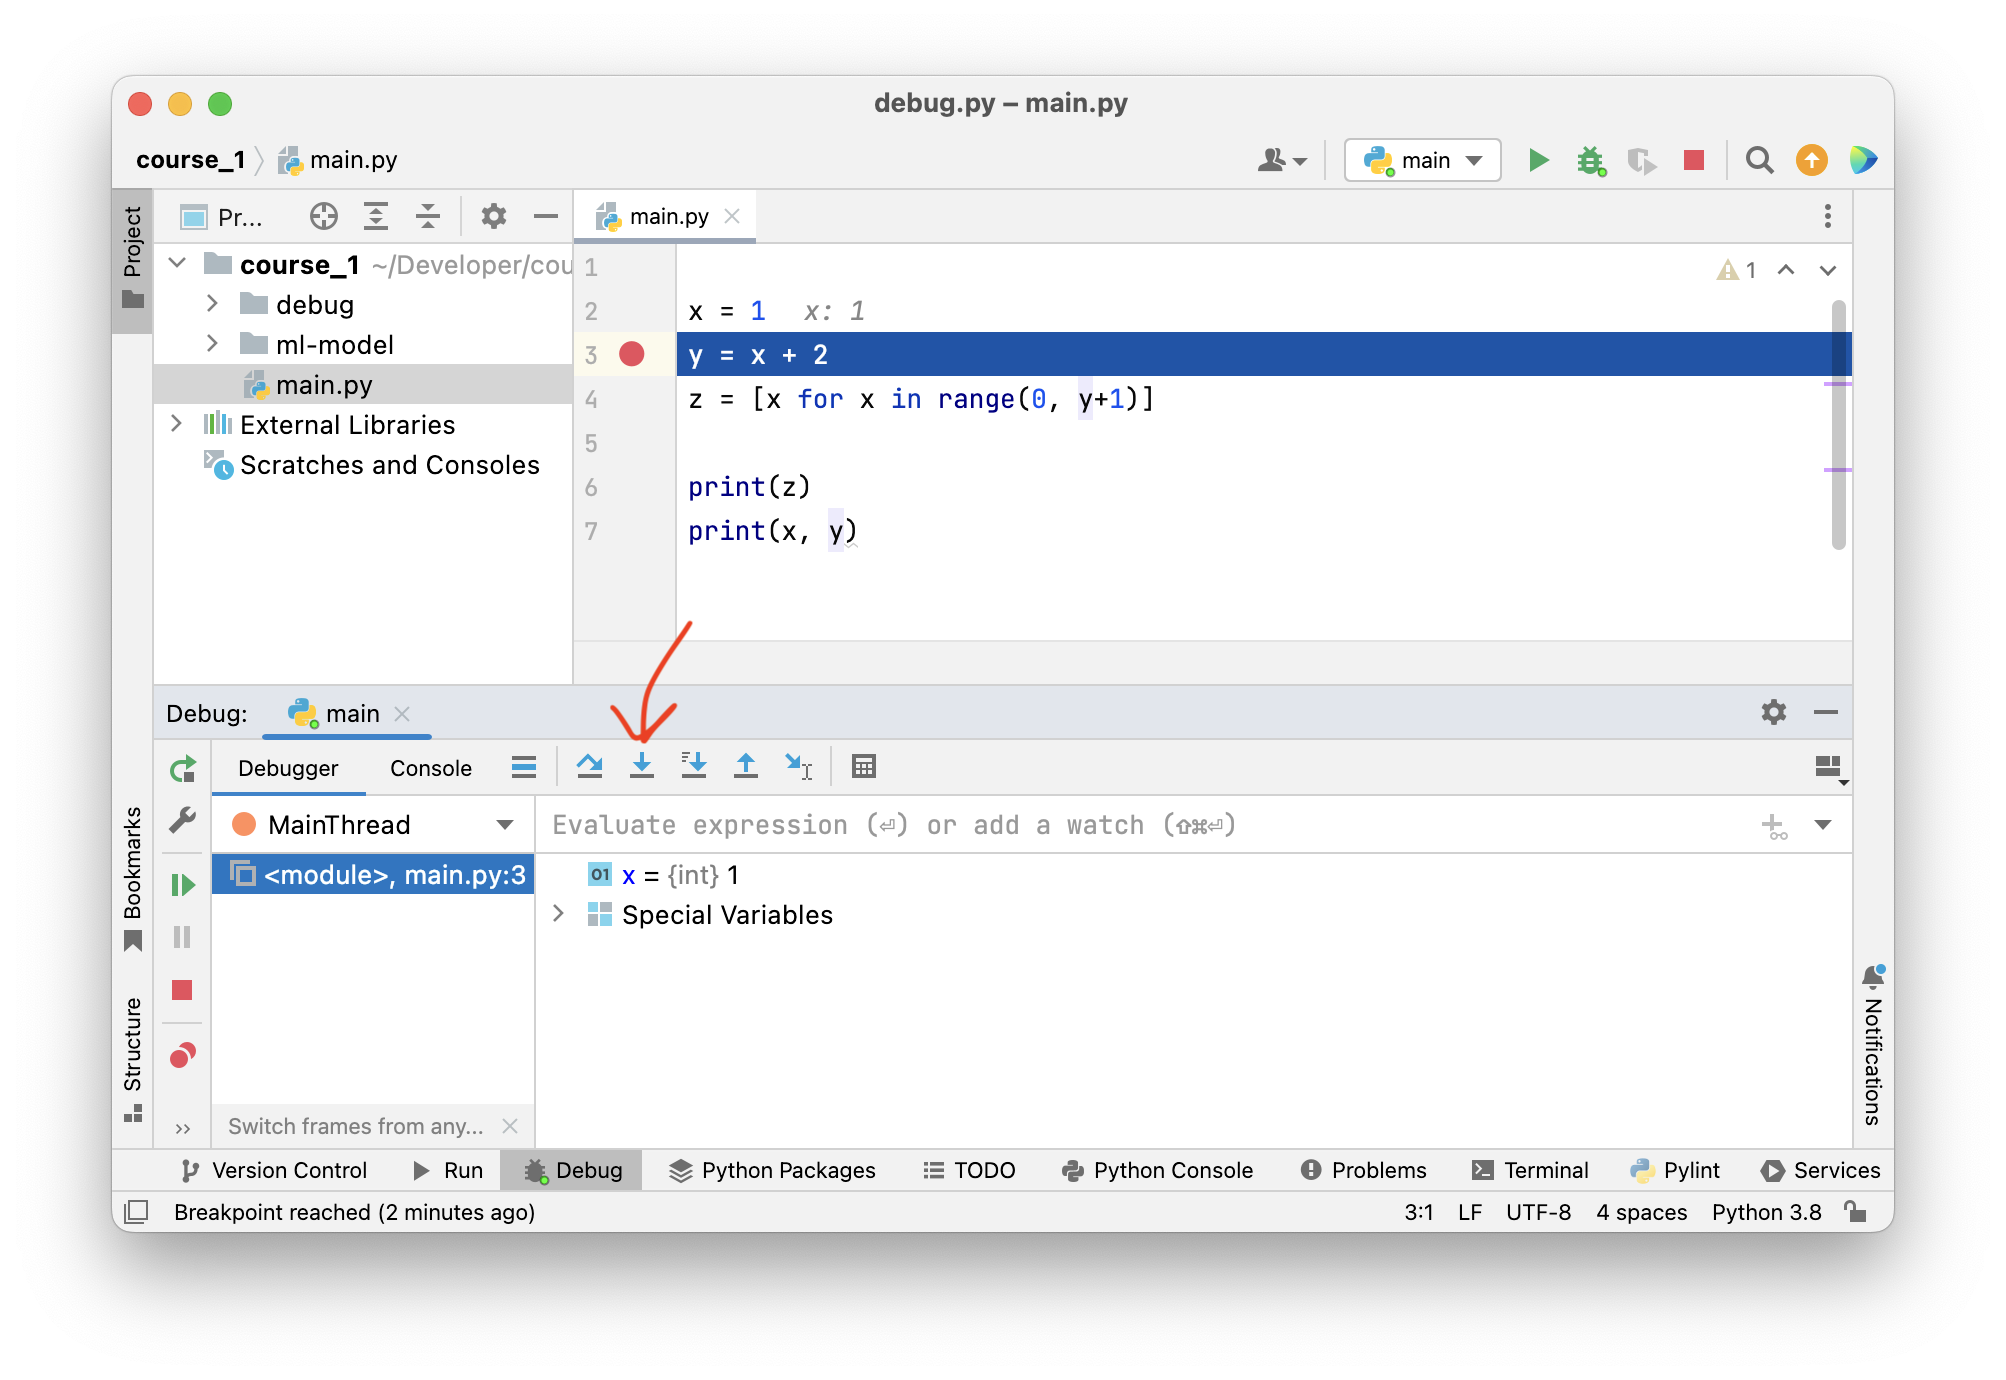
Stepping through your code line by line
Sometimes it is helpful to debug your code line by line. You can do that by setting a breakpoint early in your code and then pressing the “Step into” button repeatedly to advance your code one line at a time:
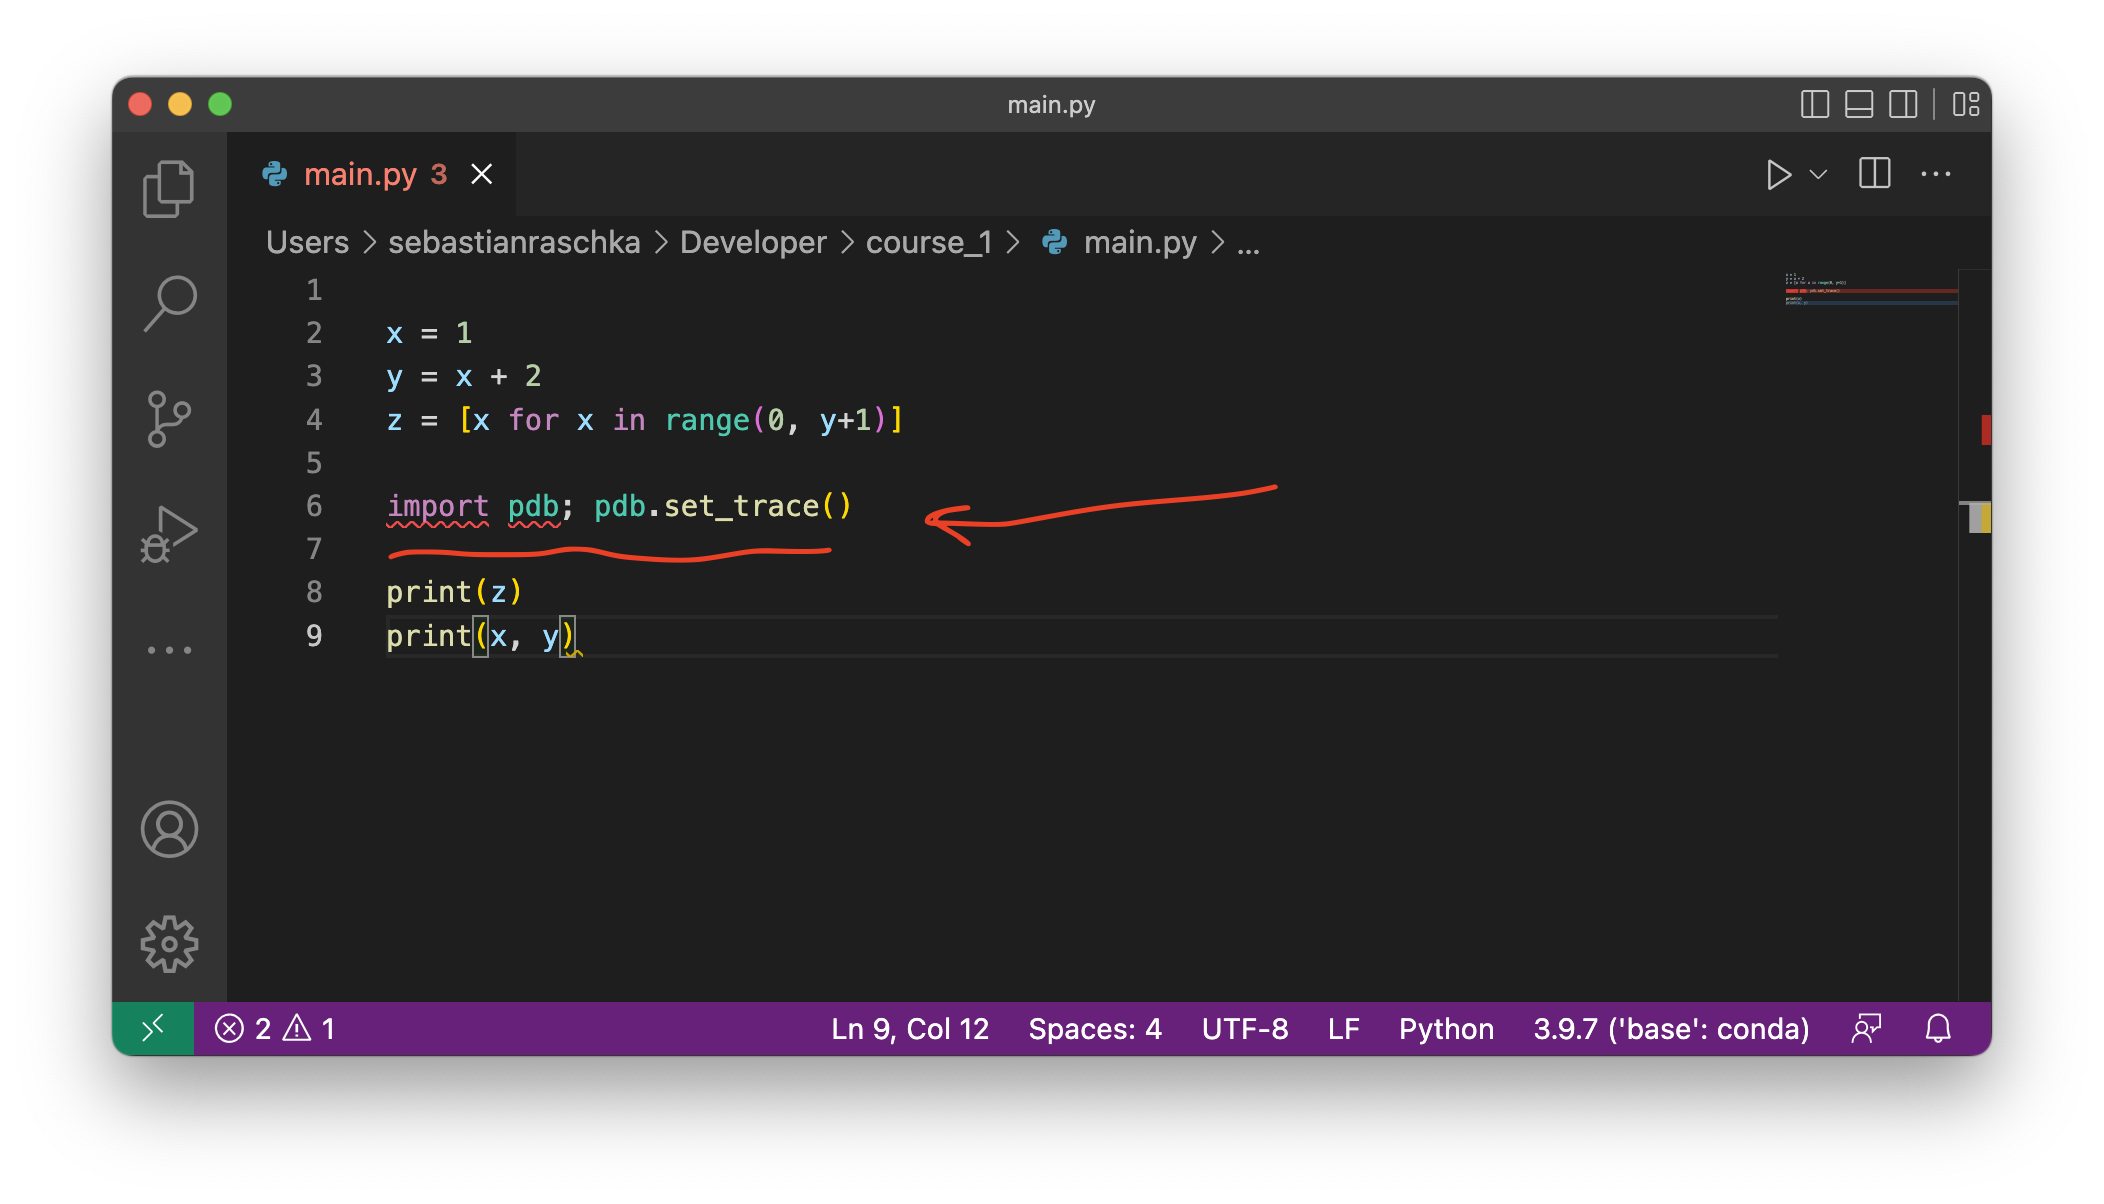
Debugging code in the terminal using the built-in pdb module
Sometimes you want to debug code on a remote machine or server (more on running code remotely in a future episode) and don’t have access to PyCharm. In this case, the pdb module in Python’s standard library might be a good option.
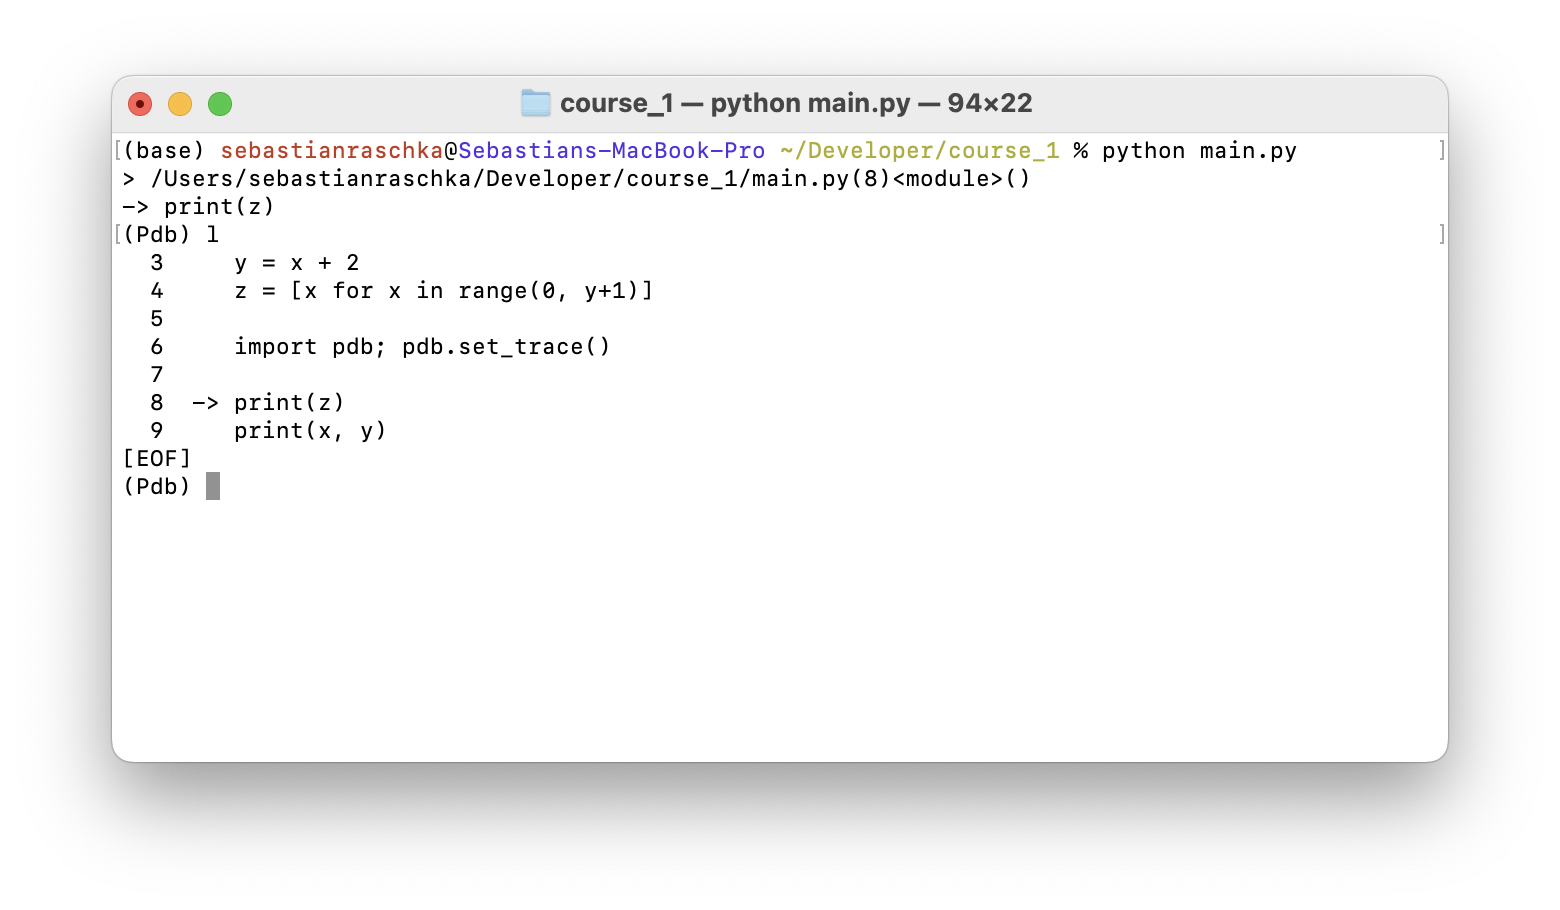
For more information on using pdb, we recommend seeing the official documentation at https://docs.python.org/3/library/pdb.html, which includes a section describing the different debugger commands.
The most common debugger commands are:
lorll(longlist) shows the current position in the codehfor helpsto execute the current lineqto quit
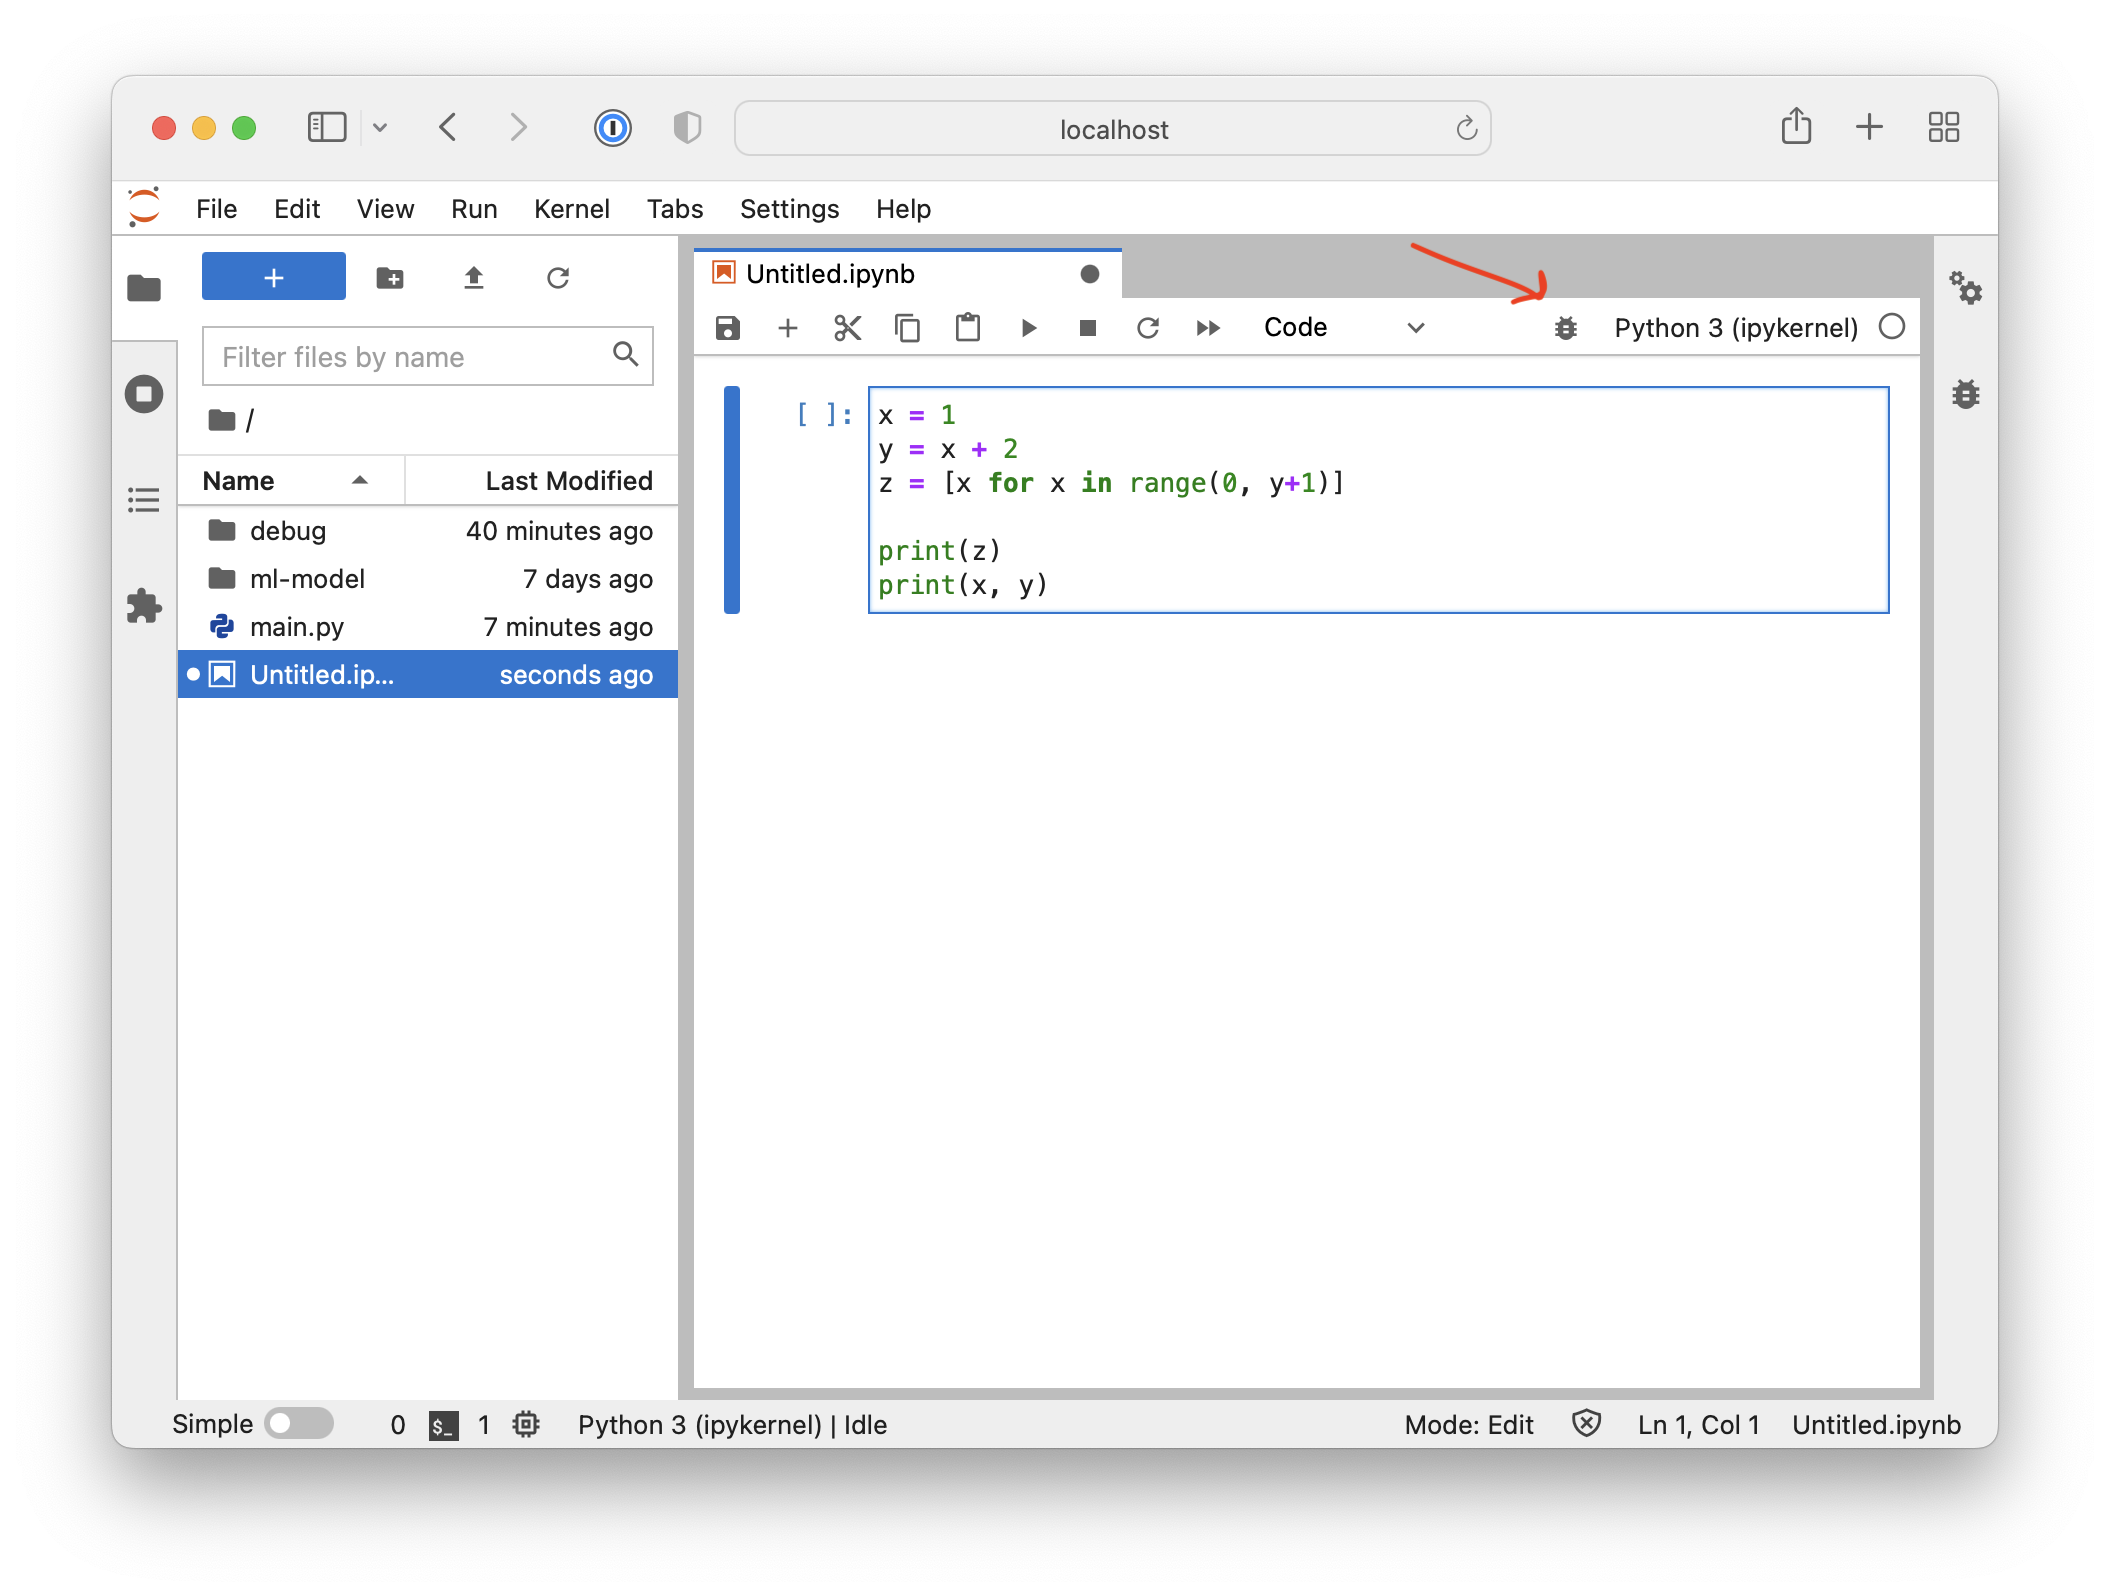
Optional: Debugging in JupyterLab
Note that JupyterLab has a very powerful debugger as well. You can launch it by clicking on the “bug” symbol similar to PyCharm:
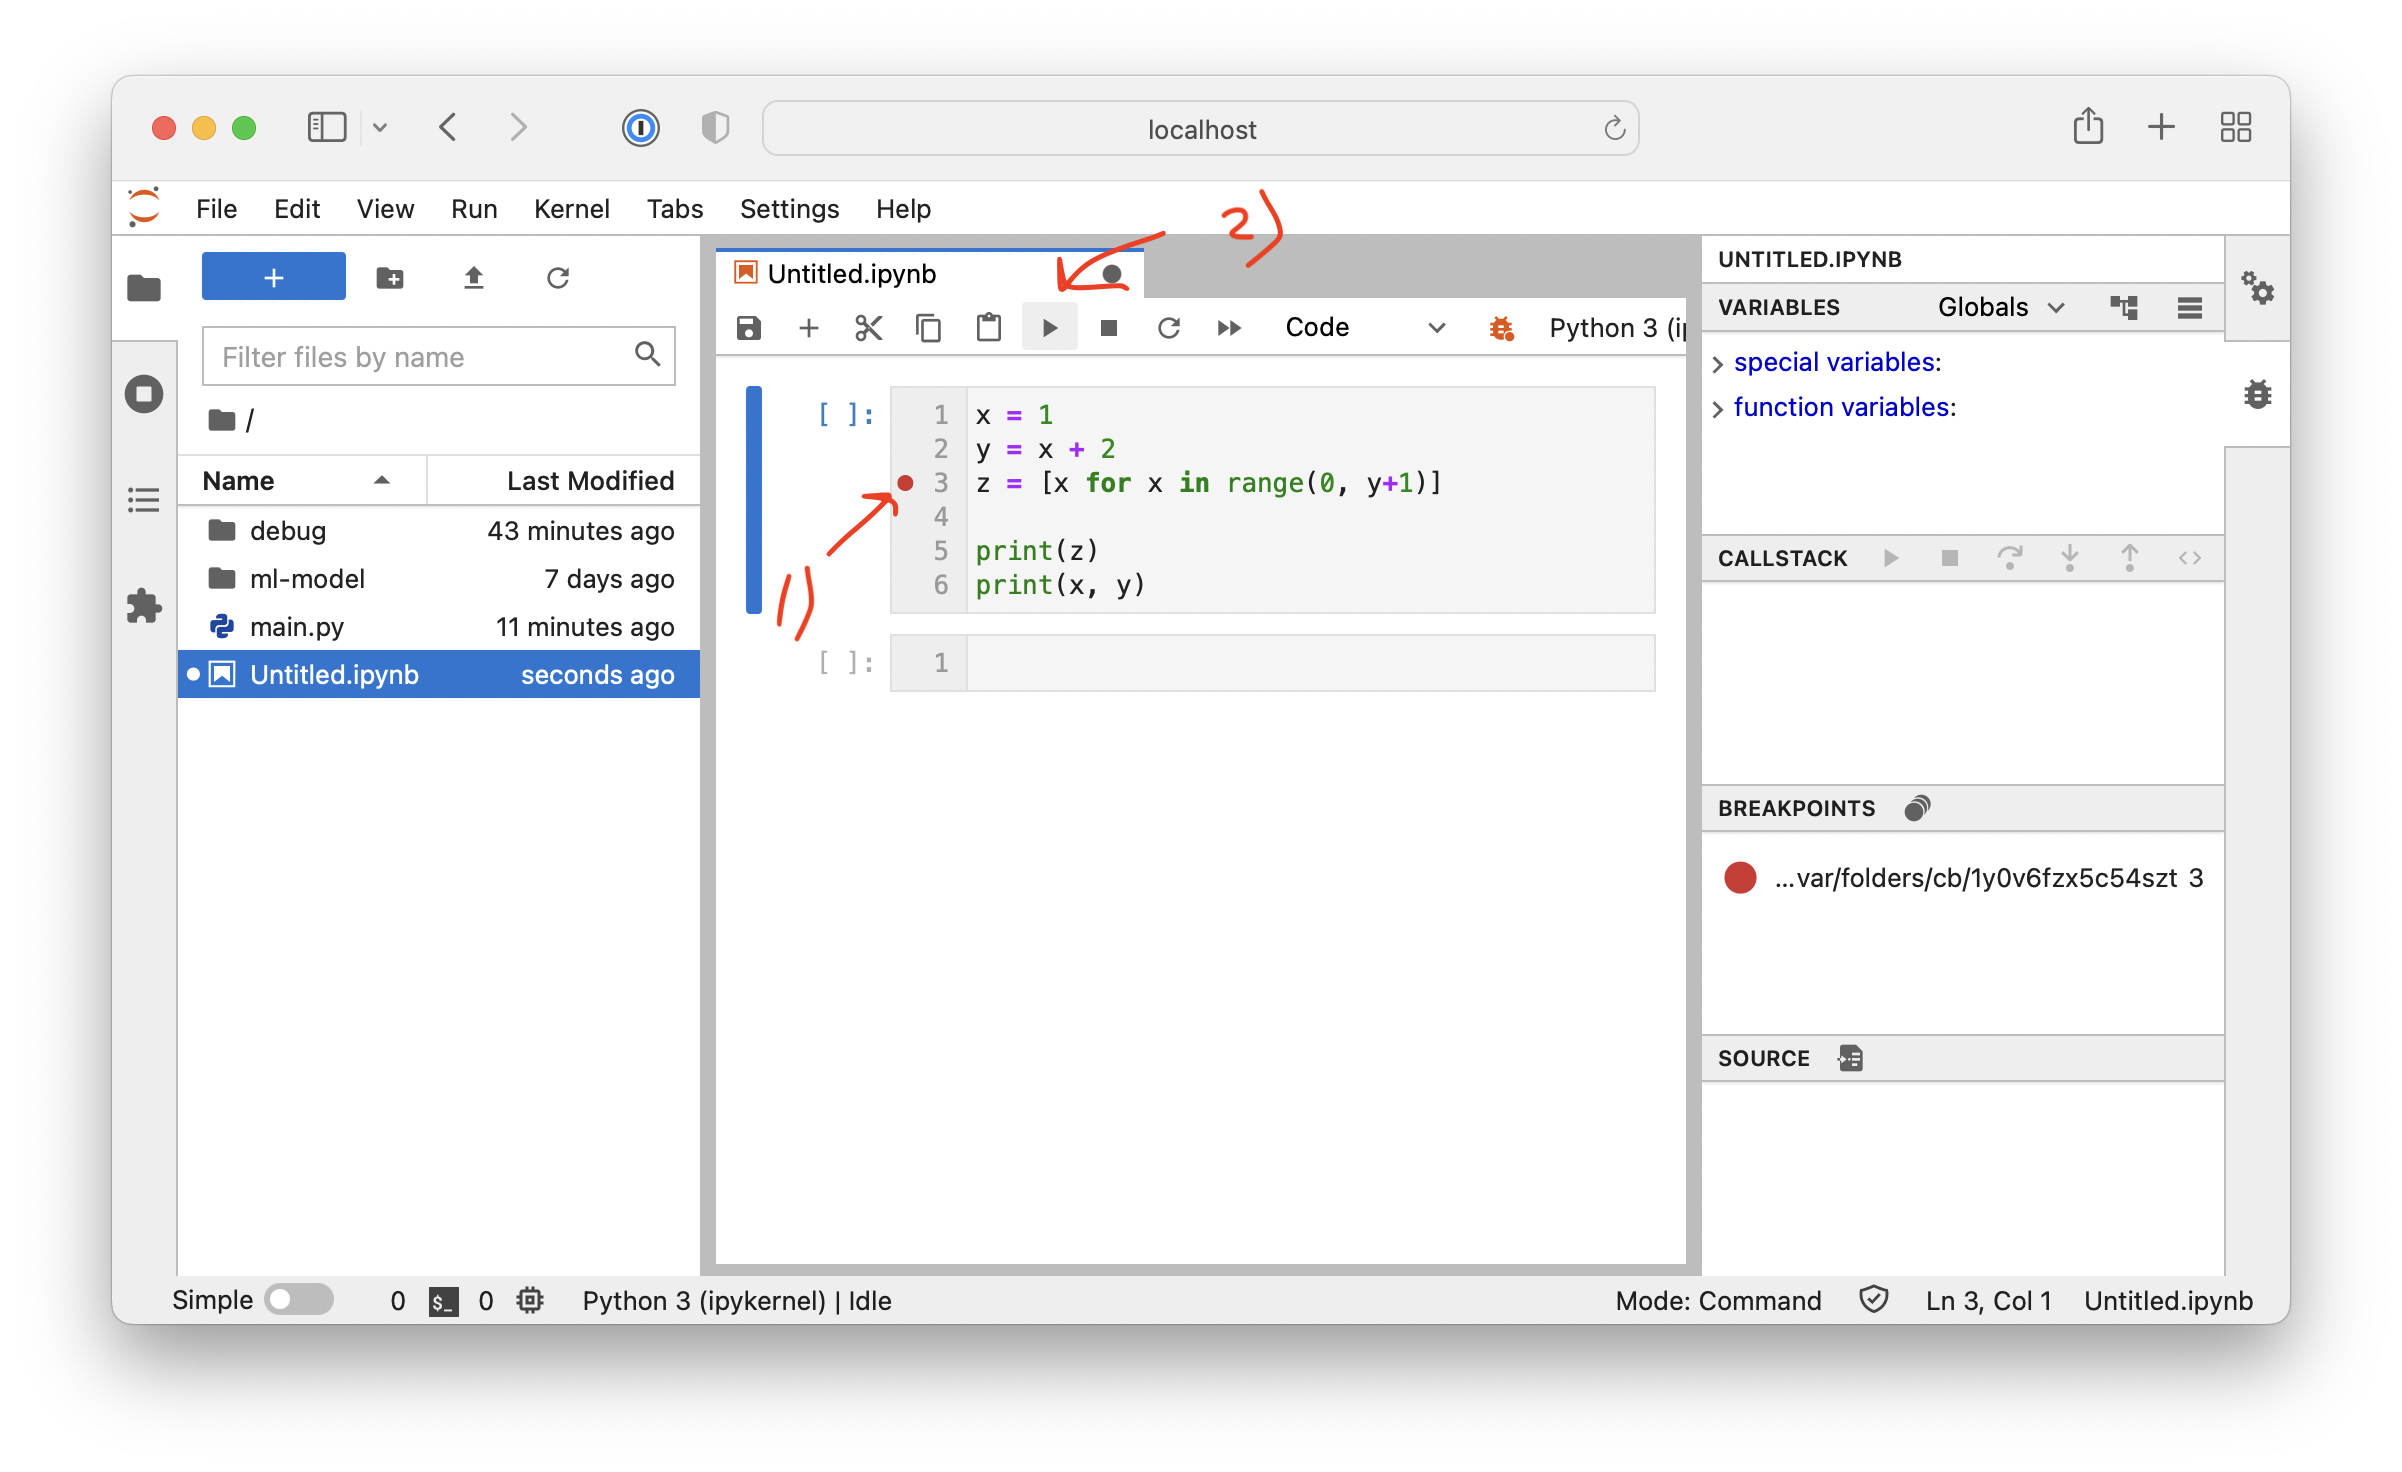
The user interface is very similar to PyCharm as well, where you can click next to the line number in order to add a breakpoint. And after setting breakpoints, you can click on “play” to start the debugger:
Stay tuned for future episodes of Lightning Bits! Also, if you have any questions, please don’t hesitate to reach out on Slack!