Torchmetrics v1.1 is out now! The latest release includes 128 PyTorch metrics implementations and an easy-to-use API to create custom metrics. In this version, there are 5 new metrics, including 2 for evaluating Generative AI models and quality-of-life improvements that make it even easier to use.
Perceptual Path Length
Introduced in the famous StyleGAN paper in 2018, the perceptual path length metric is used to quantify how smoothly a Generative AI model interpolates between points in its latent space. In this context, smoothness means that a partial input change leads to partial output changes.
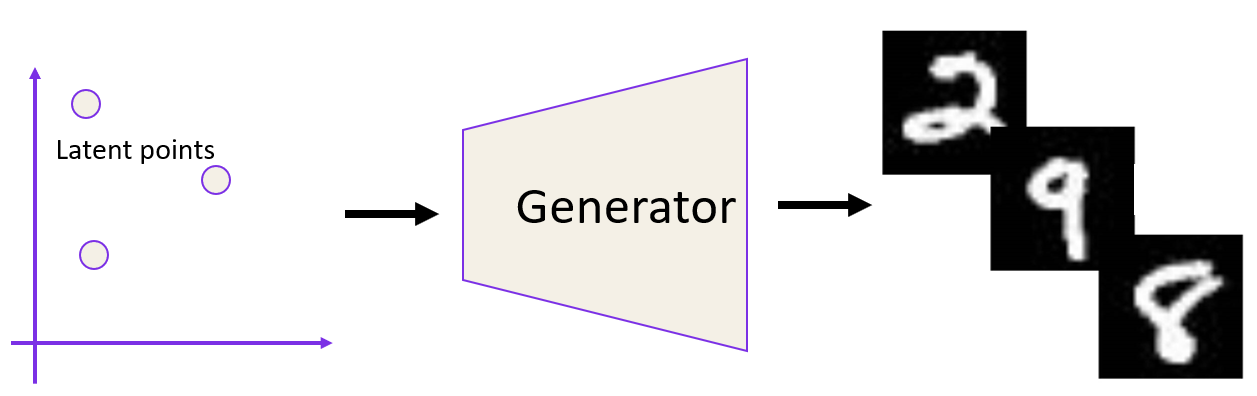
Why does this matter? Assume you have a model for generating images (think VAE, GANs, or Stable Diffusion). The way to generate different images from those models is by picking different latent points from a low-dimensional latent space (see figure below) and passing them one by one to the model.
Now assume you find a latent point (let’s call it z) that generates an image you like, but you would like to find variations of that image. The simple thought is to add a small change to z and check the output image. If your latent space is smooth, you can see that small changes in picking latent points (close points to each other) lead to marginal visual changes in the generated images compared to bigger point changes (picked points are further from each other) yield in visually significant changes in the generated images. If you have a non-smooth latent space, even small changes to the latent points can lead to large changes in the generated images.
A smooth latest space also allows you to smoothly interpolate/sample any two latent points, yielding in smooth visual changes in the generated images, as shown below.
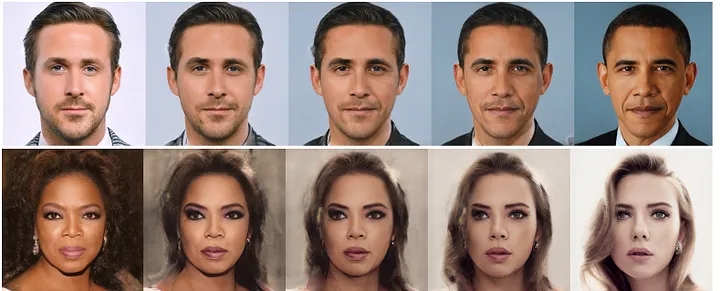
Two examples of smooth interpolation between famous persons from the Image2StyleGAN paper.
This is one reason how to distinguish between good and bad generators – the good ones have a smooth latent space.
To calculate the perceptual path length in Torchmetrics, you need a generator model that implements a forward method that generates images from latent points and a sample method that samples latent points.
from torchmetrics.functional.image import perceptual_path_length
class DummyGenerator(torch.nn.Module):
def __init__(self, z_size) -> None:
super().__init__()
self.z_size = z_size
self.model = torch.nn.Sequential(
torch.nn.Linear(z_size, 3*128*128),
torch.nn.Sigmoid()
)
def forward(self, z):
return 255 * (self.model(z).reshape(-1, 3, 128, 128) + 1)
def sample(self, num_samples):
return torch.randn(num_samples, self.z_size)
generator = DummyGenerator(2)
print(perceptual_path_length(generator, num_samples=10))
# tensor(0.1945),
# tensor(0.1222),
# tensor([0.0990, 0.4173, 0.1628, 0.3573, 0.1875, 0.0335, 0.1095, 0.1887, 0.1953])
The metric returns a tuple of three tensors: 1) the average perceptual path length, 2) the standard variation in perceptual path length, and 3) the perceptual path length per sample. The metric is sample-based, meaning that internally, it samples num_samples pairs of latent points and calculates the smoothness between them. We recommend always using at least 10,000 samples when evaluating your final generator.
CLIP image quality assessment
CLIP image quality assessment (CLIPIQA) is a metric proposed in this paper and built on the OpenAI CLIP model, which is a multimodal model for connecting text and images. The core concept underlying this metric is that different properties of an image can be measured by measuring how similar the CLIP embedding of the image is to the CLIP embedding of a positive and negative prompt for that given property.
The framework can give a score between 0 and 1 for any prompt pair, assuming one is positive and the other is negative. The higher the score, the more similar the image is to the positive prompt. See the example below.
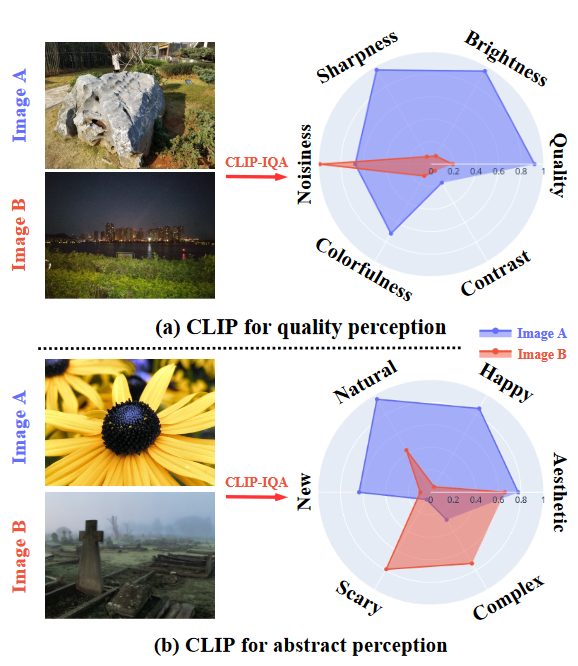
From CLIPIQA paper
In Torchmetrics, you need to choose one or more of the build prompts when initializing the metric and provide the images afterward. The returned value contains the probability of the positive prompt for each image.
from torchmetrics.image import CLIPImageQualityAssessment
imgs = torch.randint(255, (2, 3, 224, 224)).float()
metric = CLIPImageQualityAssessment(prompts=("quality", "brightness"))
print(metric(imgs))
# {'quality': tensor([0.8894, 0.8902]),
# 'brightness': tensor([0.5507, 0.5208])}
VIF, Edit, and SA-SDR
Torchmetrics v1.1 also includes these three metrics:
VisualInformationFidelityhas been added to the image package. The metric was first proposed in this paper and can be used to assess the quality of images in a perceptual manner automatically.
from torchmetrics.image import VisualInformationFidelity
preds = torch.randn([32, 3, 41, 41])
target = torch.randn([32, 3, 41, 41])
vif = VisualInformationFidelity()
vif(preds, target)
# tensor(0.0032)
EditDistancehas been added to the text package. This is a classic text metric that measures the number of characters that need to be substituted, inserted, or deleted to transform the predicted text into the reference text.
from torchmetrics.text import EditDistance
metric = EditDistance()
metric(["rain"], ["shine"])
# tensor(3.)
SourceAggregatedSignalDistortionRatiohas been added to the audio package. This paper originally proposed this metric and improved the classical Signal-to-Distortion Ratio (SDR) metric. It provides more stable gradients during training models for style source separation.
from torchmetrics.audio import SourceAggregatedSignalDistortionRatio

preds = torch.randn(2, 8000) # [..., spk, time]
target = torch.randn(2, 8000)
sasdr = SourceAggregatedSignalDistortionRatio()
sasdr(preds, target)
# tensor(-41.6579)
Quality of life improvements
MeanAveragePrecision, the most common metric for object detection, has received two quality-of-life improvements. It is now possible to evaluate both bounding box and segmentation inputs simultaneously. Just provideiou_type=["bbox", "segm"], and the same metric instance will calculate the mAP value in both cases. In addition, the metric class now contains an additional argument calledextended_summary=False/True. By default, it isFalse, but setting it toTruewill return the IOU scores and precision-recall curves.RetrievalMRRfrom the retrieval subpackage now supports thetop_kargument for calculating only the top K relevance when doing retrieval tasks.
Bugfixes
From Torchmetrics v1.0 to v1.1, there have been three small bug-fix releases.
- We fixed metrics labels and missing scores on the newly introduced plotting interface.
MetricCollection,CalibrationError,AUROC,MeanMetric,PearsonCorrCoeffhave seen smaller fixes related to specific corner cases.
We always recommend upgrading to the latest Torchmetrics release. Please refer to our changelog for the full overview of newly added features, changes, deprecations, and bug fixes.
Thank you!
As always, we offer a big thank you to all of our community members for their contributions and feedback. Please open an issue in the repo if you have any recommendations for the next metrics we should tackle.
We are happy to see the continued adoption of TorchMetrics in over 2,400 projects, and we are proud to release that we have passed 1,600 GitHub stars.
If you want to ask a question or join us in expanding Torchmetrics, please join our discord server, where you can ask questions and get guidance in the #torchmetrics channel.
🔥 Check out the documentation and code! 🚀