Mean
Module Interface
- class torchmetrics.MeanMetric(nan_strategy='warn', **kwargs)[source]
Aggregate a stream of value into their mean value.
As input to
forwardandupdatethe metric accepts the following inputvalue(floatorTensor): a single float or an tensor of float values with arbitary shape(...,).weight(floatorTensor): a single float or an tensor of float value with arbitary shape(...,). Needs to be broadcastable with the shape ofvaluetensor.
As output of forward and compute the metric returns the following output
agg(Tensor): scalar float tensor with aggregated (weighted) mean over all inputs received
- Parameters
nan_strategy¶ (
Union[str,float]) –- options:
'error': if any nan values are encounted will give a RuntimeError'warn': if any nan values are encounted will give a warning and continue'ignore': all nan values are silently removeda float: if a float is provided will impude any nan values with this value
kwargs: Additional keyword arguments, see Advanced metric settings for more info.
- Raises
ValueError – If
nan_strategyis not one oferror,warn,ignoreor a float
Example
>>> from torchmetrics.aggregation import MeanMetric
>>> metric = MeanMetric()
>>> metric.update(1)
>>> metric.update(torch.tensor([2, 3]))
>>> metric.compute()
tensor(2.)
Initializes internal Module state, shared by both nn.Module and ScriptModule.
- plot(val=None, ax=None)[source]
Plot a single or multiple values from the metric.
- Parameters
val¶ (
Union[Tensor,Sequence[Tensor],None]) – Either a single result from calling metric.forward or metric.compute or a list of these results. If no value is provided, will automatically call metric.compute and plot that result.ax¶ (
Optional[Axes]) – An matplotlib axis object. If provided will add plot to that axis
- Return type
- Returns
Figure and Axes object
- Raises
ModuleNotFoundError – If matplotlib is not installed
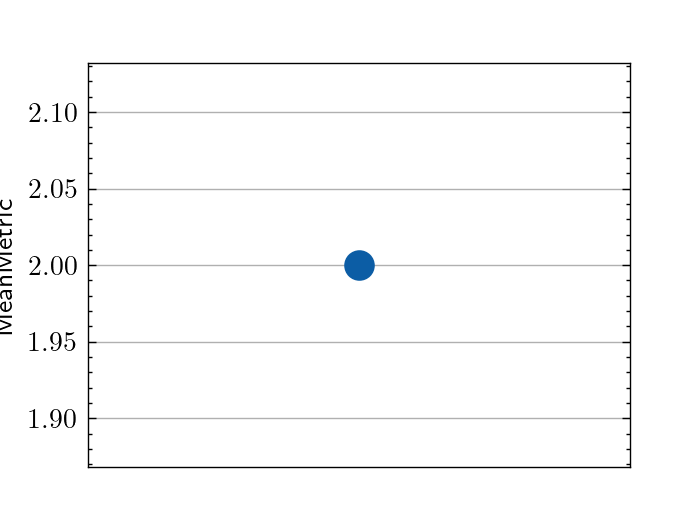
>>> # Example plotting a single value
>>> from torchmetrics.aggregation import MeanMetric
>>> metric = MeanMetric()
>>> metric.update([1, 2, 3])
>>> fig_, ax_ = metric.plot()
(
Source code,png,hires.png,pdf)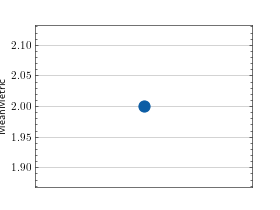
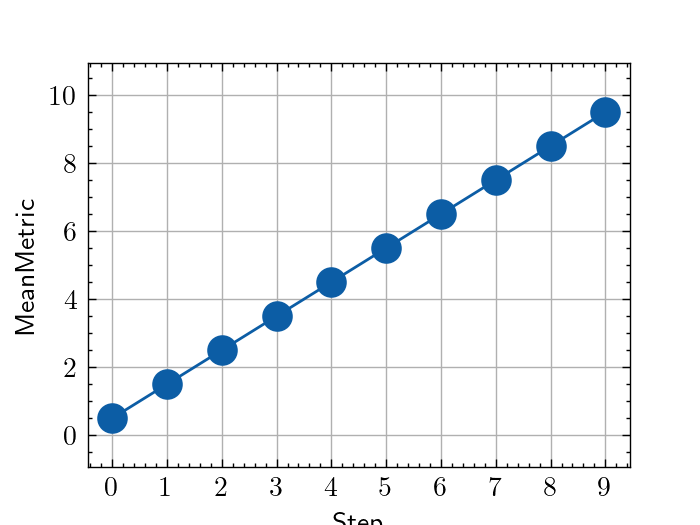
>>> # Example plotting multiple values
>>> from torchmetrics.aggregation import MeanMetric
>>> metric = MeanMetric()
>>> values = [ ]
>>> for i in range(10):
...     values.append(metric([i, i+1]))
>>> fig_, ax_ = metric.plot(values)
(
Source code,png,hires.png,pdf)
