Track and Visualize Experiments (basic)
Audience: Users who want to visualize and monitor their model development
Why do I need to track metrics?
In model development, we track values of interest such as the validation_loss to visualize the learning process for our models. Model development is like driving a car without windows, charts and logs provide the windows to know where to drive the car.
With Lightning, you can visualize virtually anything you can think of: numbers, text, images, audio. Your creativity and imagination are the only limiting factor.
Track metrics
Metric visualization is the most basic but powerful way of understanding how your model is doing throughout the model development process.
To track a metric, simply use the self.log method available inside the LightningModule
class LitModel(L.LightningModule):
    def training_step(self, batch, batch_idx):
        value = ...
        self.log("some_value", value)
To log multiple metrics at once, use self.log_dict
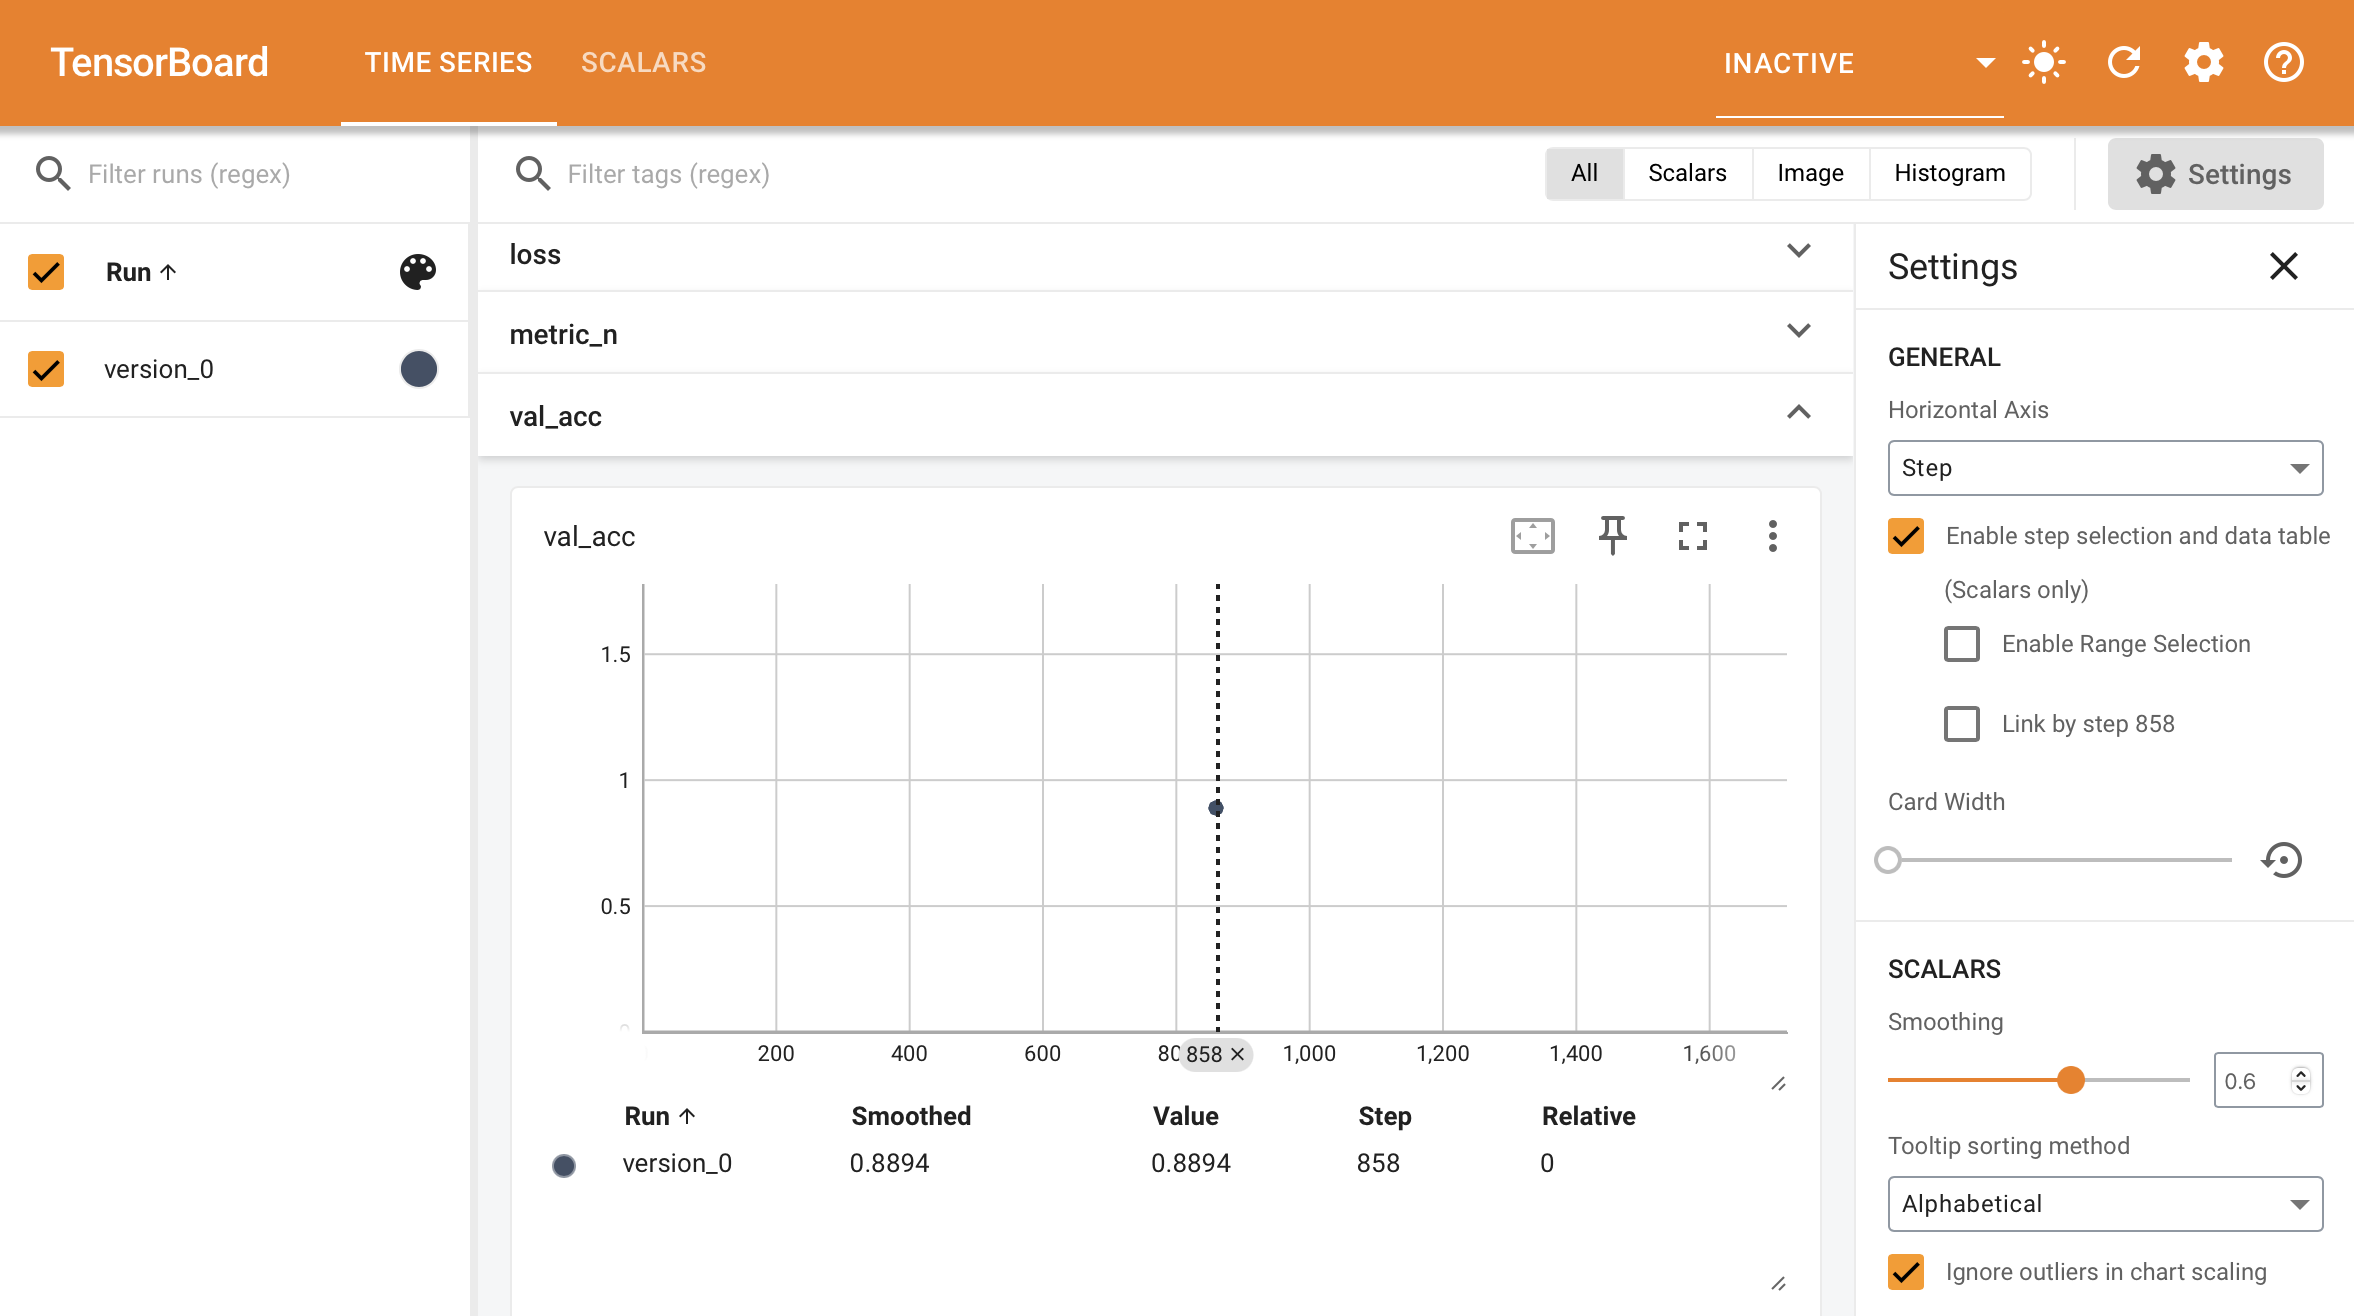
values = {"loss": loss, "acc": acc, "metric_n": metric_n}  # add more items if needed
self.log_dict(values)
Todo
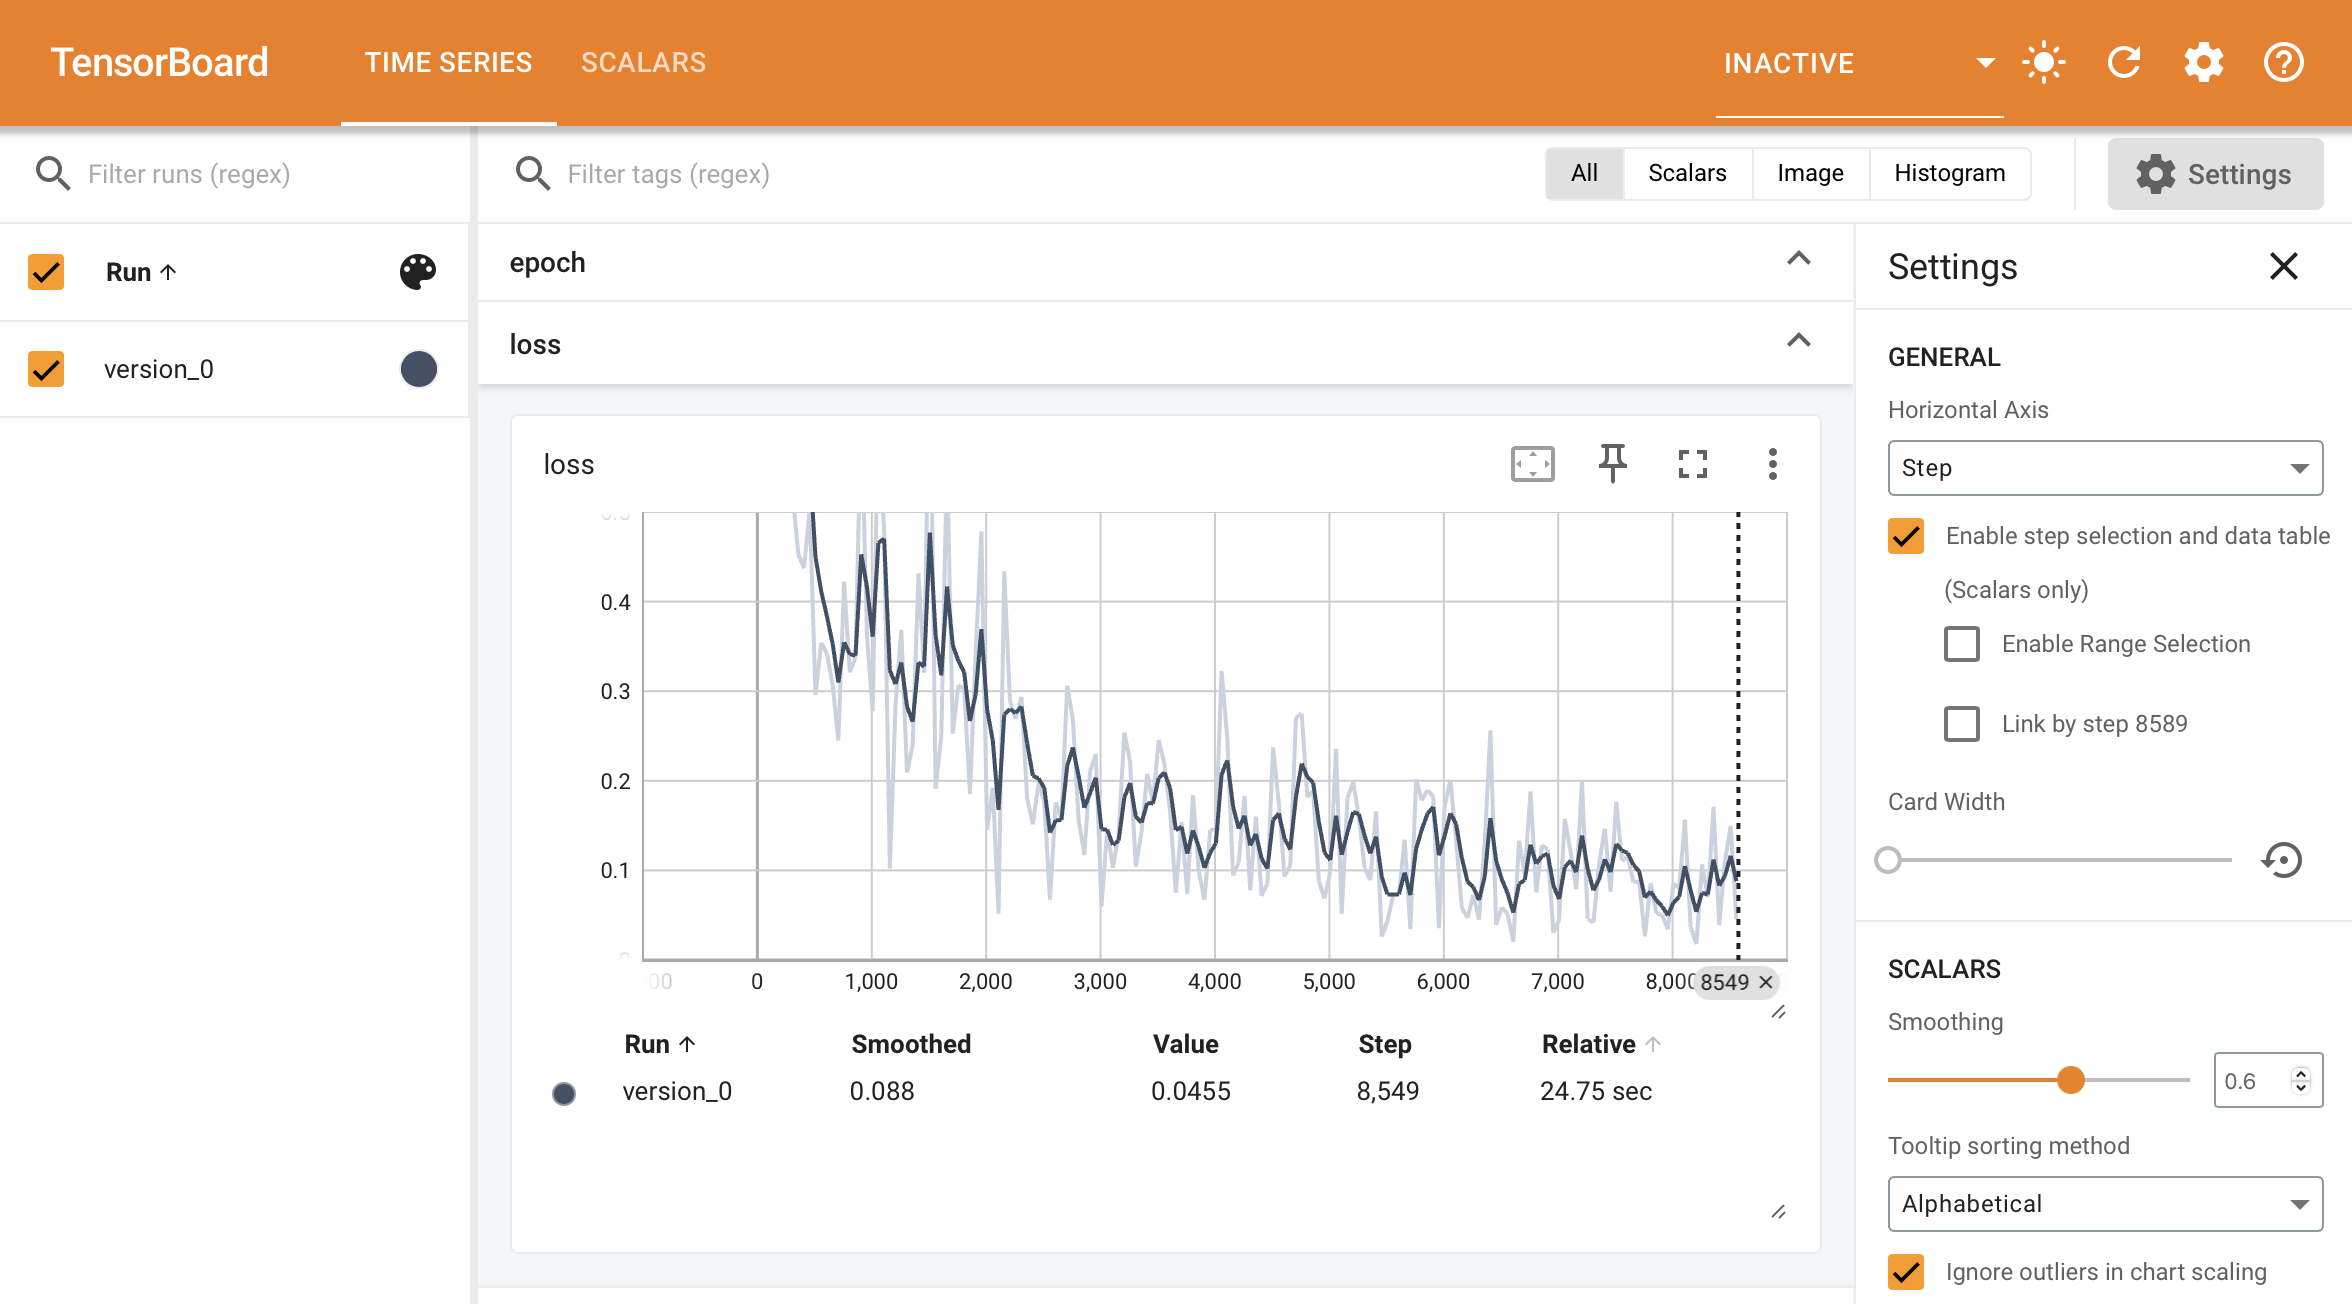
show plot of metric changing over time
View in the commandline
To view metrics in the commandline progress bar, set the prog_bar argument to True.
self.log(..., prog_bar=True)
Epoch 3: 33%|███▉ | 307/938 [00:01<00:02, 289.04it/s, loss=0.198, v_num=51, acc=0.211, metric_n=0.937]
View in the browser
To view metrics in the browser you need to use an experiment manager with these capabilities.
By Default, Lightning uses Tensorboard (if available) and a simple CSV logger otherwise.
# every trainer already has tensorboard enabled by default (if the dependency is available)
trainer = Trainer()
To launch the tensorboard dashboard run the following command on the commandline.
tensorboard --logdir=lightning_logs/
If you’re using a notebook environment such as colab or kaggle or jupyter, launch Tensorboard with this command
%reload_ext tensorboard
%tensorboard --logdir=lightning_logs/
Accumulate a metric
When self.log is called inside the training_step, it generates a timeseries showing how the metric behaves over time.

However, For the validation and test sets we are not generally interested in plotting the metric values per batch of data. Instead, we want to compute a summary statistic (such as average, min or max) across the full split of data.
When you call self.log inside the validation_step and test_step, Lightning automatically accumulates the metric and averages it once it’s gone through the whole split (epoch).
def validation_step(self, batch, batch_idx):
    value = batch_idx + 1
    self.log("average_value", value)

If you don’t want to average you can also choose from {min,max,sum} by passing the reduce_fx argument.
# default function
self.log(..., reduce_fx="mean")
For other reductions, we recommend logging a torchmetrics.Metric instance instead.
Configure the saving directory
By default, anything that is logged is saved to the current working directory. To use a different directory, set the default_root_dir argument in the Trainer.
Trainer(default_root_dir="/your/custom/path")
